


signal strength 3 of 5
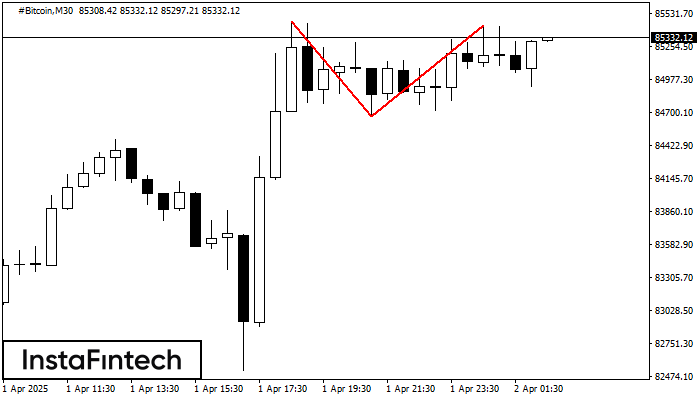
The Double Top pattern has been formed on #Bitcoin M30. It signals that the trend has been changed from upwards to downwards. Probably, if the base of the pattern 84666.85 is broken, the downward movement will continue.
انظر أيضا
- All
- Double Top
- Flag
- Head and Shoulders
- Pennant
- Rectangle
- Triangle
- Triple top
- All
- #AAPL
- #AMZN
- #Bitcoin
- #EBAY
- #FB
- #GOOG
- #INTC
- #KO
- #MA
- #MCD
- #MSFT
- #NTDOY
- #PEP
- #TSLA
- #TWTR
- AUDCAD
- AUDCHF
- AUDJPY
- AUDUSD
- EURCAD
- EURCHF
- EURGBP
- EURJPY
- EURNZD
- EURRUB
- EURUSD
- GBPAUD
- GBPCHF
- GBPJPY
- GBPUSD
- GOLD
- NZDCAD
- NZDCHF
- NZDJPY
- NZDUSD
- SILVER
- USDCAD
- USDCHF
- USDJPY
- USDRUB
- All
- M5
- M15
- M30
- H1
- D1
- All
- Buy
- Sale
- All
- 1
- 2
- 3
- 4
- 5
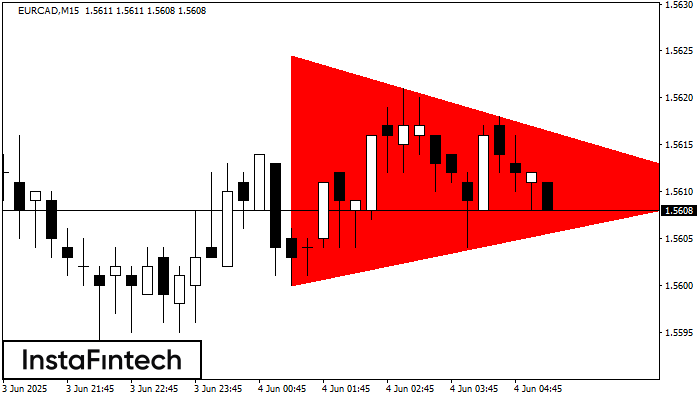
According to the chart of M15, EURCAD formed the Bearish Symmetrical Triangle pattern. This pattern signals a further downward trend in case the lower border 1.5600 is breached. Here
The M5 and M15 time frames may have more false entry points.
Open chart in a new window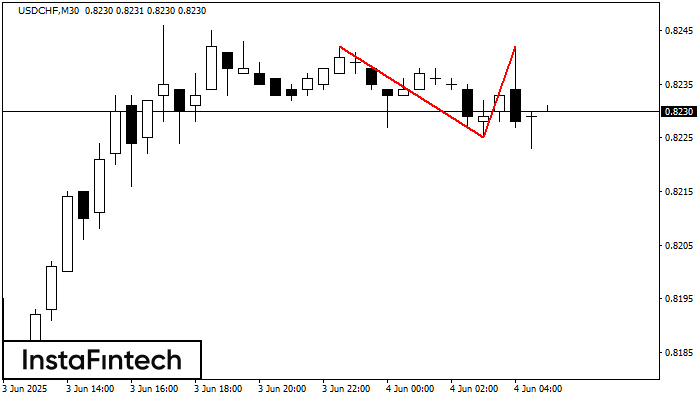
The Double Top reversal pattern has been formed on USDCHF M30. Characteristics: the upper boundary 0.8242; the lower boundary 0.8225; the width of the pattern is 17 points. Sell trades
Open chart in a new window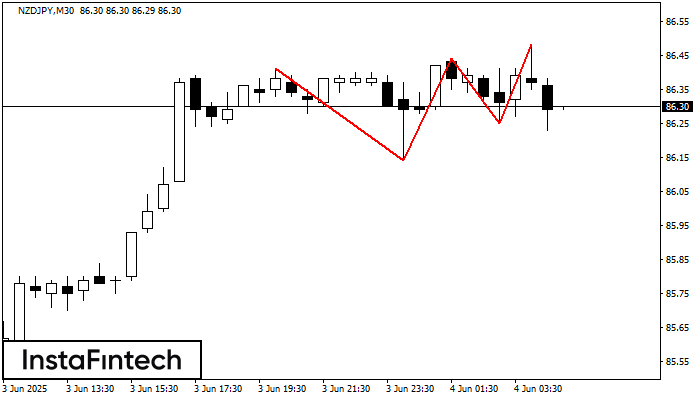
The Triple Top pattern has formed on the chart of the NZDJPY M30 trading instrument. It is a reversal pattern featuring the following characteristics: resistance level -7, support level -11
Open chart in a new window


