


signal strength 2 of 5
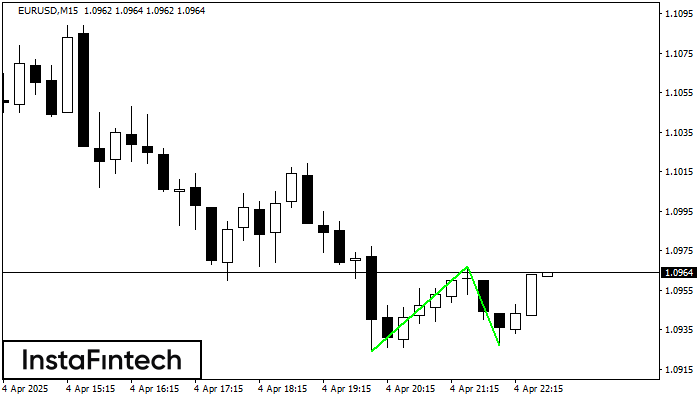
The Double Bottom pattern has been formed on EURUSD M15; the upper boundary is 1.0967; the lower boundary is 1.0927. The width of the pattern is 43 points. In case of a break of the upper boundary 1.0967, a change in the trend can be predicted where the width of the pattern will coincide with the distance to a possible take profit level.
The M5 and M15 time frames may have more false entry points.
انظر أيضا
- All
- Double Top
- Flag
- Head and Shoulders
- Pennant
- Rectangle
- Triangle
- Triple top
- All
- #AAPL
- #AMZN
- #Bitcoin
- #EBAY
- #FB
- #GOOG
- #INTC
- #KO
- #MA
- #MCD
- #MSFT
- #NTDOY
- #PEP
- #TSLA
- #TWTR
- AUDCAD
- AUDCHF
- AUDJPY
- AUDUSD
- EURCAD
- EURCHF
- EURGBP
- EURJPY
- EURNZD
- EURRUB
- EURUSD
- GBPAUD
- GBPCHF
- GBPJPY
- GBPUSD
- GOLD
- NZDCAD
- NZDCHF
- NZDJPY
- NZDUSD
- SILVER
- USDCAD
- USDCHF
- USDJPY
- USDRUB
- All
- M5
- M15
- M30
- H1
- D1
- All
- Buy
- Sale
- All
- 1
- 2
- 3
- 4
- 5
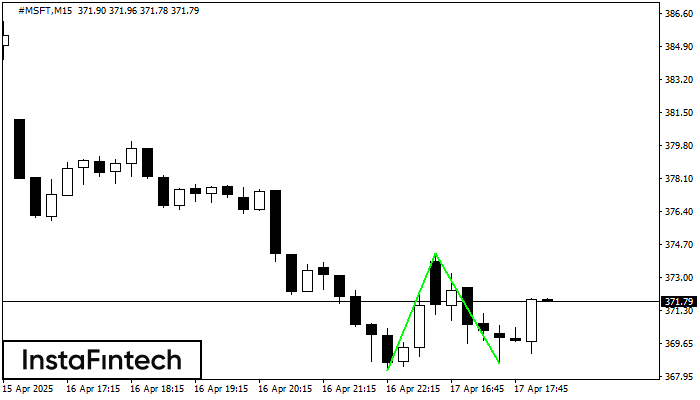
The Double Bottom pattern has been formed on #MSFT M15. This formation signals a reversal of the trend from downwards to upwards. The signal is that a buy trade should
The M5 and M15 time frames may have more false entry points.
Открыть график инструмента в новом окне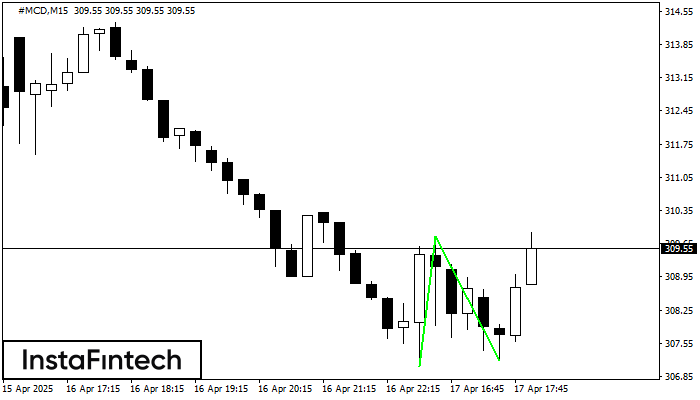
The Double Bottom pattern has been formed on #MCD M15. Characteristics: the support level 307.06; the resistance level 309.81; the width of the pattern 275 points. If the resistance level
The M5 and M15 time frames may have more false entry points.
Открыть график инструмента в новом окне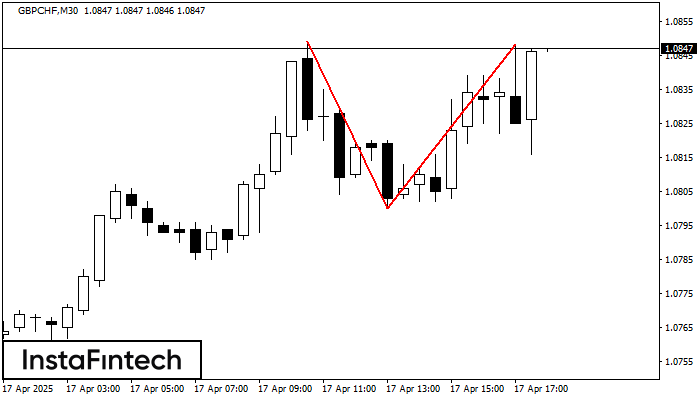
The Double Top pattern has been formed on GBPCHF M30. It signals that the trend has been changed from upwards to downwards. Probably, if the base of the pattern 1.0800
Открыть график инструмента в новом окне


