empty
06.02.2024 03:06 PM
Trading Signals for Ethereum (ETH/USD) on February 6-8, 2024: buy above $2,300 (1/8 Murray - 21 SMA)

This image is no longer relevant

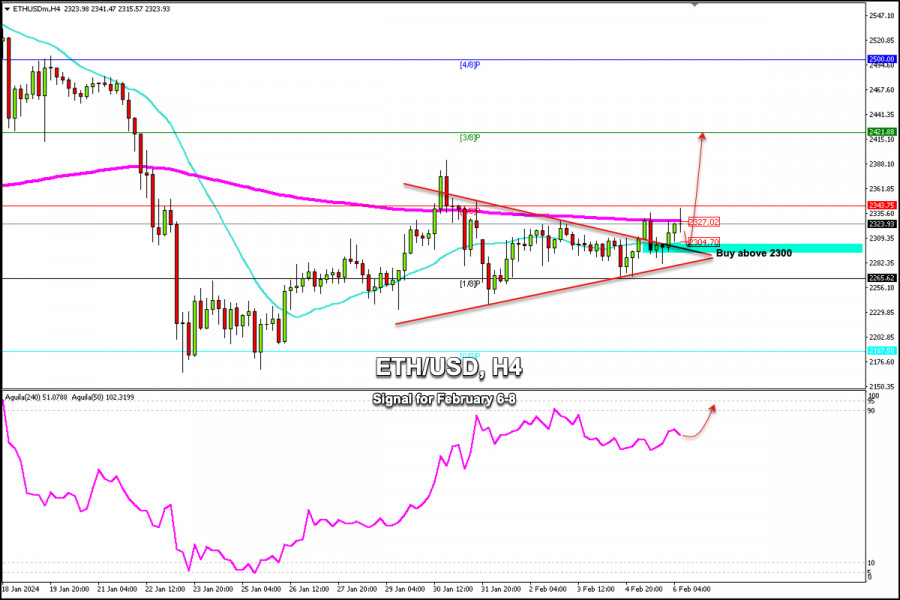
Ethereum (ETH/USD) is trading around 2,323.93, above the 21 SMA, and below 2/8 Murray. Ether has formed a symmetrical triangle pattern. The price has broken this pattern but lacks bullish strength. For the bullish perspective to be confirmed, it should consolidate above $2,345.

In case ETH/USD gains momentum and consolidates above the 200 EMA located at 2,327, we could expect the price to continue rising and it could reach 3/8 Murray at 2,421. Eventually, it could reach 4/8 Murray around a psychological level of $2,500.

Otherwise, if Ether returns below the key level of $2,300, we could expect a decline and it could reach 1/8 Murray at 2,265. Finally, it could return to the low of January 25 around 2,168.

The eagle indicator is giving a positive signal. Ether will likely gain bullish strength in the coming hours, only if it breaks sharply the area of 2,345. Otherwise, we could expect a technical correction in ETH and the price could return to levels of 2,265 (1/8 Murray).

Dimitrios Zappas,
Analytical expert of InstaForex
© 2007-2025
Select timeframe
5
min
15
min
30
min
1
hour
4
hours
1
day
1
week
Earn on cryptocurrency rate changes with InstaForex
Download MetaTrader 4 and open your first trade
  • Grand Choice
    Contest by
    InstaForex
    InstaForex always strives to help you
    fulfill your biggest dreams.
    JOIN CONTEST

Recommended Stories

Forex forecast 23/06/2025: EUR/USD, GBP/USD, USDX, Oil, Ethereum and Bitcoin

Useful links: My other articles are available in this section InstaForex course for beginners Popular Analytics Open trading account Important: The begginers in forex trading need to be very careful

Sebastian Seliga 12:08 2025-06-23 UTC+2

Technical Analysis for the Week of June 23–28: GBP/USD Currency Pair

Last week, the pair moved downward and tested the 14.6% pullback level at 1.3392 (red dashed line), after which the price rebounded and closed the weekly candle at 1.3446

Stefan Doll 11:38 2025-06-23 UTC+2

Technical Analysis for the Week of June 23–28: EUR/USD Currency Pair

Last week, the pair moved downward and tested the 76.4% pullback level at 1.1452 (red dashed line), after which the price rebounded and closed the weekly candle at 1.1520

Stefan Doll 11:31 2025-06-23 UTC+2

Forecast for EUR/USD on June 23, 2025

On Friday, the EUR/USD pair continued to rise after rebounding from the 76.4% corrective level at 1.1454. However, on Monday night, the pair returned to this level. A new rebound

Samir Klishi 11:24 2025-06-23 UTC+2

Forecast for GBP/USD on June 23, 2025

On the hourly chart, the GBP/USD pair on Friday consolidated below the support zone of 1.3425–1.3444, once again allowing for the expectation of a continued decline toward the support level

Samir Klishi 11:19 2025-06-23 UTC+2

Technical Analysis of Daily Price Movement of USD/IDR Exotic Currency Pairs, Monday June 23, 2025.

16473.27 Currently on the Daily chart, the Exotic USD/IDR currency pair has a Bullish 123 pattern which indicates that USD/IDR is currently strengthening, where this is also confirmed

Arief Makmur 07:29 2025-06-23 UTC+2

Technical Analysis of Intraday Price Movement of Crude Oil Commodity Instrument, Monday June 23, 2025.

In addition to the appearance of Divergence between the price movement of Crude Oil and the Stochastic Oscillator indicator on the 4-hour chart, there is also a Bearish 123 pattern

Arief Makmur 07:29 2025-06-23 UTC+2

EUR/USD Forecast for June 23, 2025

A bearish divergence has formed on the weekly chart for the euro. We are preparing for a reversal into a long-term downward trend, but divergences with a gap often unfold

Laurie Bailey 05:00 2025-06-23 UTC+2

GBP/USD Forecast for June 23, 2025

The British pound opened the new week with a downward gap, which still preserves bullish optimism. There remains potential for the price to return above the resistance level at 1.3433

Laurie Bailey 04:56 2025-06-23 UTC+2

Oil Forecast for June 23, 2025

On the weekly chart, the signal line of the Marlin oscillator has begun to reverse from the 9.3600 level. Historically, this level has marked significant downward reversals—in April 2023, October

Laurie Bailey 04:56 2025-06-23 UTC+2
Can't speak right now?
Ask your question in the chat.
Widget callback
 

Dear visitor,

Your IP address shows that you are currently located in the USA. If you are a resident of the United States, you are prohibited from using the services of InstaFintech Group including online trading, online transfers, deposit/withdrawal of funds, etc.

If you think you are seeing this message by mistake and your location is not the US, kindly proceed to the website. Otherwise, you must leave the website in order to comply with government restrictions.

Why does your IP address show your location as the USA?

  • - you are using a VPN provided by a hosting company based in the United States;
  • - your IP does not have proper WHOIS records;
  • - an error occurred in the WHOIS geolocation database.

Please confirm whether you are a US resident or not by clicking the relevant button below. If you choose the wrong option, being a US resident, you will not be able to open an account with InstaForex anyway.

We are sorry for any inconvenience caused by this message.