empty
30.10.2024 07:16 PM
Analysis of GBP/USD pair on October 30, 2024

This image is no longer relevant

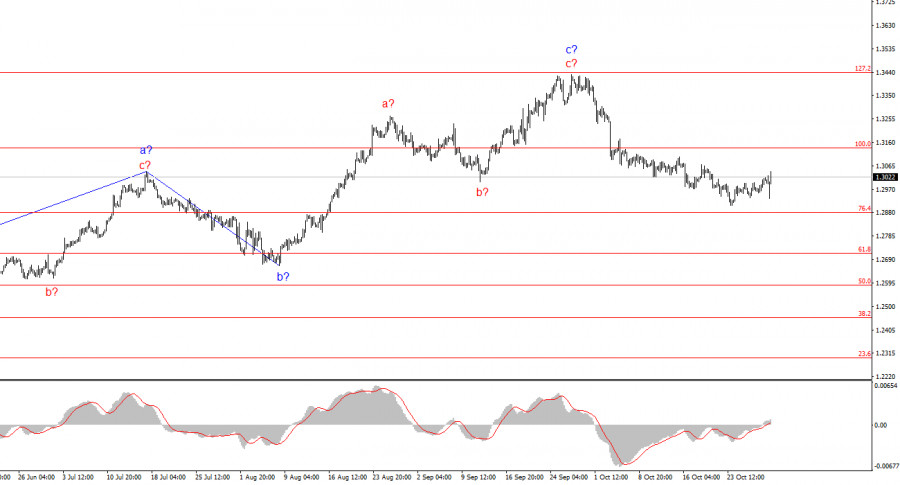
The GBP/USD wave structure remains complex and continues to develop. At one point, the wave pattern appeared convincing, suggesting the formation of a downward wave sequence with targets below the 1.2300 level. However, demand for the pound has risen so sharply that it disrupts any clear wave structure. Currently, there is a possibility of forming a new downward trend segment, but certain factors cast doubt on this, such as the ambiguous attempt to break the low of wave b within wave c.

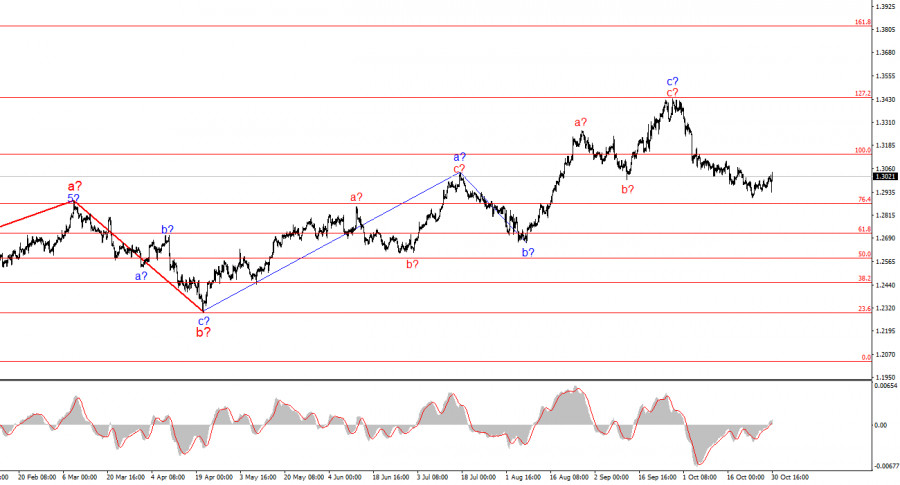
Since April 22, a series of a-b-c waves have emerged, each containing its own a-b-c formation. Considering the wave structure of EUR/USD, which indicates a downward wave sequence, now seems like a favorable time to initiate a new trend segment. However, the pound remains influenced by the Bank of England, which is in no rush to lower rates. Recently, demand for the pound has decreased, which indicates a potential for a sustained downward wave sequence.

No signs of a corrective wave have appeared yet. Despite a 15 basis point drop in GBP/USD on Wednesday, demand for the British currency grew steadily during the U.S. session. In my view, this is a false rally for both the euro and the pound, as the market reacted to the "weak" U.S. GDP report while disregarding the strong ADP report. It's also too early to draw conclusions ahead of Thursday and Friday. Tomorrow, the Eurozone's inflation data for October will be released, which may support the euro and, in turn, the pound. Meanwhile, U.S. labor market and unemployment reports on Friday could strengthen the dollar, potentially driving both pairs down again.

Considering recent developments, I wouldn't make any final conclusions on the current wave structure until the end of the week. The overall market sentiment remains "bearish," with a downward wave sequence taking shape. News could potentially support both the pound and the dollar. In my view, a substantial decline in the pound may not start until later. The first wave appears convincing on the 4-hour chart but looks weak on the daily. Other waves are notably stronger and more prolonged, suggesting that the recent decline in the pound over the past month may not yet reflect the full extent of its decline.

This image is no longer relevant

General Conclusions

The GBP/USD wave structure remains quite complex. The current pattern suggests that the trend segment from April 22 may have taken the form of an a-b-c wave sequence, which could now be complete. From the 1.3440 mark, aligning with the 127.2% Fibonacci level, one could cautiously open short positions. Currently, traders may wait for a corrective upward wave and then look to sell again, though the decline may continue within the first wave. The impulsive nature of this wave, indicating a rapid directional change, is becoming increasingly certain, and the pair may reach the 1.2800–1.2900 levels in the near term.

On a higher time frame, the wave structure has evolved. We might now anticipate a complex and prolonged upward corrective structure. Currently, it is forming a three-wave sequence, but it could expand into a five-wave structure, which could take several months or even longer to complete.

Key Principles of My Analysis:

  1. Wave structures should be simple and comprehensible. Complex structures are challenging to trade and often undergo changes.
  2. If there is uncertainty in the market's direction, it's better to avoid entering positions.
  3. One can never be 100% confident in the market's direction. Always remember to set protective Stop Loss orders.
  4. Wave analysis can be combined with other types of analysis and trading strategies.
Chin Zhao,
Analytical expert of InstaForex
© 2007-2025
Select timeframe
5
min
15
min
30
min
1
hour
4
hours
1
day
1
week
Earn on cryptocurrency rate changes with InstaForex
Download MetaTrader 4 and open your first trade
  • Grand Choice
    Contest by
    InstaForex
    InstaForex always strives to help you
    fulfill your biggest dreams.
    JOIN CONTEST

Recommended Stories

GBP/USD Analysis on July 2, 2025

The wave pattern for GBP/USD continues to suggest the formation of an upward impulsive wave sequence. The wave pattern closely resembles that of EUR/USD, since the U.S. dollar remains

Chin Zhao 20:33 2025-07-02 UTC+2

EUR/USD Analysis on July 2, 2025

The wave pattern on the 4-hour chart for EUR/USD continues to indicate the formation of an upward trend segment. The trade war initiated by Donald Trump was intended to boost

Chin Zhao 20:31 2025-07-02 UTC+2

GBP/USD Analysis on June 30, 2025

The wave pattern for GBP/USD continues to suggest the formation of an upward impulsive wave pattern. The wave picture is nearly identical to that of EUR/USD, as the U.S. dollar

Chin Zhao 20:00 2025-06-30 UTC+2

EUR/USD Analysis on June 30, 2025

The wave pattern on the 4-hour chart for EUR/USD continues to indicate the formation of an upward trend segment. Until February 28, when the U.S. dollar began to decline

Chin Zhao 19:47 2025-06-30 UTC+2

Weekly Forecast Based on Simplified Wave Analysis for GBP/USD, AUD/USD, USD/CHF, EUR/JPY, EUR/CHF, and the US Dollar Index as of June 30th

In the coming trading days, the British pound is expected to continue its sideways movement. A return to the resistance zone is likely, followed by a possible reversal and resumption

Isabel Clark 11:27 2025-06-30 UTC+2

Weekly Forecast Based on Simplified Wave Analysis for EUR/USD, USD/JPY, GBP/JPY, USD/CAD, NZD/USD, and GOLD as of June 30th

In the coming days, the euro is expected to remain in a sideways flat phase. Near the calculated resistance area, there is a high chance of a pause

Isabel Clark 10:57 2025-06-30 UTC+2

GBP/USD Analysis on June 26, 2025

The wave pattern for GBP/USD continues to indicate the development of a bullish impulsive wave structure. The wave layout is almost identical to that of EUR/USD, as the sole reason

Chin Zhao 19:27 2025-06-26 UTC+2

EUR/USD Analysis on June 26, 2025

The wave pattern on the 4-hour chart for EUR/USD continues to indicate the formation of an upward trend segment. Until February 28, when the decline of the U.S. dollar began

Chin Zhao 19:20 2025-06-26 UTC+2

EUR/USD Analysis on June 25, 2025

The wave pattern on the 4-hour chart for EUR/USD continues to indicate the formation of a bullish trend segment. Until February 28, when the U.S. dollar began to decline

Chin Zhao 19:10 2025-06-25 UTC+2

GBP/USD Analysis on June 24, 2025

The wave pattern for GBP/USD continues to indicate the formation of a bullish impulsive wave sequence. The wave pattern is nearly identical to that of EUR/USD, as the main driver

Chin Zhao 19:35 2025-06-24 UTC+2
Can't speak right now?
Ask your question in the chat.
Widget callback
 

Dear visitor,

Your IP address shows that you are currently located in the USA. If you are a resident of the United States, you are prohibited from using the services of InstaFintech Group including online trading, online transfers, deposit/withdrawal of funds, etc.

If you think you are seeing this message by mistake and your location is not the US, kindly proceed to the website. Otherwise, you must leave the website in order to comply with government restrictions.

Why does your IP address show your location as the USA?

  • - you are using a VPN provided by a hosting company based in the United States;
  • - your IP does not have proper WHOIS records;
  • - an error occurred in the WHOIS geolocation database.

Please confirm whether you are a US resident or not by clicking the relevant button below. If you choose the wrong option, being a US resident, you will not be able to open an account with InstaForex anyway.

We are sorry for any inconvenience caused by this message.