empty
24.03.2025 02:55 PM
S&P 500: from euphoria to collapse

This image is no longer relevant

The wave of optimism that swept through US stock markets following Donald Trump's re-election turned out to be short-lived. Euphoria quickly gave way to a deep correction amid escalating trade conflicts.

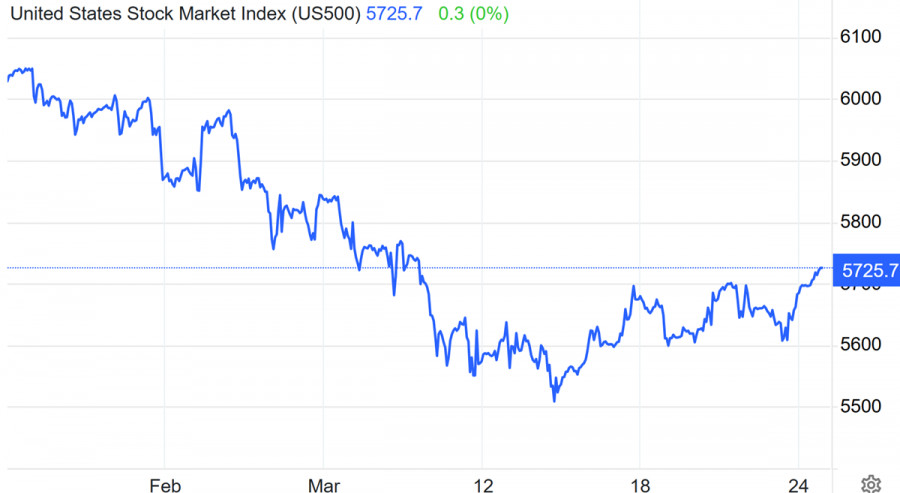
The introduction of new tariffs on goods from China, Canada, and Mexico triggered panic among investors. On March 3, US markets experienced the largest sell-off of the year, with the S&P 500 erasing all post-election gains, sliding back to 5,660.

Fundamental risks deepen the decline

The outlook for the US economy continues to worsen. The Atlanta Fed slashed its forecast for real GDP growth from +2.3% to -2.8% YoY. Meanwhile, warnings of an impending recession are becoming more frequent.

Warren Buffett has openly criticized Trump's trade policies, calling tariffs a "tax on consumers." Jeremy Grantham predicts a collapse of US stock indices, while Ray Dalio goes as far as to describe the economic outlook as a potential "heart attack," citing the growing budget deficit and mounting debt crisis.

Technical picture: support on the brink, trend under threat

On Monday, the S&P 500 is trading near 5,770, confirming a significant correction from its recent record highs. The index has broken below the upward trendline formed in January and dropped beneath the critical 5,720 support level, which now acts as resistance.

Current key technical levels:

Support: 5,600 – a psychologically important level. A break below it could open the way to 5,450 and 5,300.

Resistance: 5,720 (near-term), followed by 5,840.

Indicators: the RSI is heading into oversold territory, signaling a possible short-term bounce. However, MACD and moving averages still confirm a bearish momentum.

This image is no longer relevant

Trading ideas:

Short-term buy from 5,600 targeting 5,720, with a stop-loss at 5,550.

Sell on bounce from the 5,720–5,740 zone targeting 5,450, then 5,300 – particularly if negative news flow continues.

Mid-term strategy: hold short positions with a target of 5,300 and below, if trade tensions escalate and macroeconomic data deteriorate.

Fundamental risks: default fears and inflationary pressures

The main driver of the current correction is a fundamental shock caused by the sudden shift in US trade policy. The Trump administration's renewed protectionist push has already led to higher import costs, intensifying inflationary pressures.

According to Yale University, tariffs are costing the average American around $2,000 per year – effectively functioning as an invisible tax.

At the same time, the Federal Reserve is caught in a bind between a slowing economy and the need to contain inflation. GDP contraction, a ballooning budget deficit (now at 7.5% of GDP), and the possibility of tighter monetary policy are all contributing to investor anxiety.

The capital market is increasingly seen as overheated, especially given high debt levels and falling corporate earnings. Much of the recent bull market has been driven not by solid fundamentals, but by the Fed's ultra-loose monetary policy.

S&P 500 enters the danger zone

The combination of technical weakness and mounting fundamental risks leaves the market vulnerable to further declines. Over the coming weeks, the market's fate will likely be determined by new trade decisions from the White House and the Fed's response.

Traders should proceed with extreme caution – we're entering a phase of elevated turbulence.

Natalya Andreeva,
Analytical expert of InstaForex
© 2007-2025
Select timeframe
5
min
15
min
30
min
1
hour
4
hours
1
day
1
week
Earn on cryptocurrency rate changes with InstaForex
Download MetaTrader 4 and open your first trade
  • Grand Choice
    Contest by
    InstaForex
    InstaForex always strives to help you
    fulfill your biggest dreams.
    JOIN CONTEST

Recommended Stories

Update on US stock market on July 3. SP500 and NASDAQ update their highs

The S&P 500 rose by 0.47%, while the Nasdaq 100 gained 0.94%. The industrial Dow Jones, however, slipped by 0.02%. Asian stock indices posted modest gains ahead of the upcoming

Jakub Novak 13:15 2025-07-03 UTC+2

US stock market: S&P 500 hits new record high

S&P500 Snapshot of major US stock indices on Wednesday: * Dow: +0.0% * NASDAQ: +0.9% * S&P 500: +0.5% * S&P 500 closed at 6,227, trading within a range

Jozef Kovach 13:15 2025-07-03 UTC+2

US equities: bulls steady, broader market leads

S&P 500 Overview on July 2 US market: bulls hold their ground, broader market leads The main US indices on Tuesday: Dow +0.9%, NASDAQ -0.8%, S&P 500 -0.1%. S&P

Jozef Kovach 13:04 2025-07-02 UTC+2

Update on US stock market on July 2. SP500 and NASDAQ enjoy buoyant demand

At the close of trading yesterday, US stock indices ended the day mixed. The S&P 500 declined by 0.11%, while the Nasdaq 100 fell by 0.82%. In contrast

Jakub Novak 12:48 2025-07-02 UTC+2

US market holds near highs

S&P 500 Overview on July 1 US market pauses at highs Major US indices on Monday: Dow +0.6%, NASDAQ +0.5%, S&P 500 +0.5%, S&P 500: 6,204, trading range: 5,700–6,300

Jozef Kovach 11:53 2025-07-01 UTC+2

Update on US stock market on July 2. SP500 and NASDAQ going on with steady growth

At the end of yesterday's trading, US stock indices closed higher. The S&P 500 rose by 0.52%, while the Nasdaq 100 gained 0.47%. The Dow Jones Industrial Average strengthened

Jakub Novak 09:52 2025-07-01 UTC+2

Update on US stock market on June 30. SP500 notches up new peak at 6,200. Inflation reports indicate stagflation

S&P500 The US stock market is ahead of a week of big news. The S&P 500 is eyeing 6,200 Snapshot of major US stock indices on Friday: Dow +1%, NASDAQ

Jozef Kovach 11:17 2025-06-30 UTC+2

Update on US stock market on June 27. SP500 and NASDAQ reach new highs

The S&P 500 rose by 0.80%, while the Nasdaq 100 added 0.97%. The Dow Jones Industrial Average climbed by 0.84%. Stocks gained amid talks that the US is getting closer

Jakub Novak 11:58 2025-06-27 UTC+2

Nvidia Shares Reach All-Time High

Yesterday, the NASDAQ technology index closed the day in positive territory, thanks largely to the rally in Nvidia Corp. shares, which reached a historic high. The leading producer

Jakub Novak 11:06 2025-06-26 UTC+2

The Stock Market Is Approaching Dangerous Levels

The wave pattern on the 24-hour chart for the #SPX instrument appears generally clear. At this point, the formation of an upward trend segment is presumably complete. In my view

Chin Zhao 12:35 2025-06-25 UTC+2
Can't speak right now?
Ask your question in the chat.
Widget callback
 

Dear visitor,

Your IP address shows that you are currently located in the USA. If you are a resident of the United States, you are prohibited from using the services of InstaFintech Group including online trading, online transfers, deposit/withdrawal of funds, etc.

If you think you are seeing this message by mistake and your location is not the US, kindly proceed to the website. Otherwise, you must leave the website in order to comply with government restrictions.

Why does your IP address show your location as the USA?

  • - you are using a VPN provided by a hosting company based in the United States;
  • - your IP does not have proper WHOIS records;
  • - an error occurred in the WHOIS geolocation database.

Please confirm whether you are a US resident or not by clicking the relevant button below. If you choose the wrong option, being a US resident, you will not be able to open an account with InstaForex anyway.

We are sorry for any inconvenience caused by this message.