


signal strength 2 of 5

The Triple Bottom pattern has been formed on EURNZD M15. It has the following characteristics: resistance level 1.9498/1.9463; support level 1.9409/1.9402; the width is 89 points. In the event of a breakdown of the resistance level of 1.9498, the price is likely to continue an upward movement at least to 1.9412.
The M5 and M15 time frames may have more false entry points.
See Also
- All
- Double Top
- Flag
- Head and Shoulders
- Pennant
- Rectangle
- Triangle
- Triple top
- All
- #AAPL
- #AMZN
- #Bitcoin
- #EBAY
- #FB
- #GOOG
- #INTC
- #KO
- #MA
- #MCD
- #MSFT
- #NTDOY
- #PEP
- #TSLA
- #TWTR
- AUDCAD
- AUDCHF
- AUDJPY
- AUDUSD
- EURCAD
- EURCHF
- EURGBP
- EURJPY
- EURNZD
- EURRUB
- EURUSD
- GBPAUD
- GBPCHF
- GBPJPY
- GBPUSD
- GOLD
- NZDCAD
- NZDCHF
- NZDJPY
- NZDUSD
- SILVER
- USDCAD
- USDCHF
- USDJPY
- USDRUB
- All
- M5
- M15
- M30
- H1
- D1
- All
- Buy
- Sale
- All
- 1
- 2
- 3
- 4
- 5
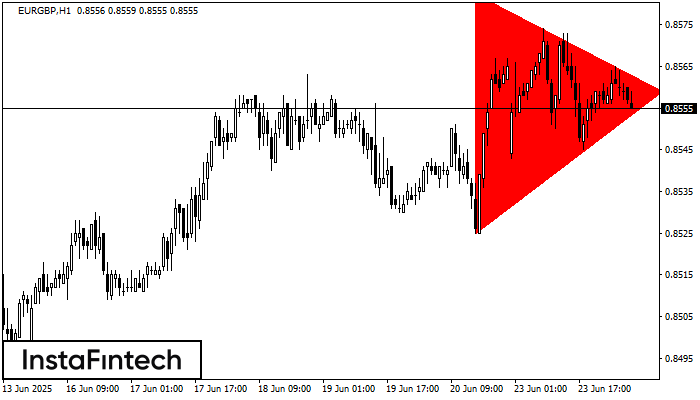
According to the chart of H1, EURGBP formed the Bearish Symmetrical Triangle pattern. Description: The lower border is 0.8525/0.8559 and upper border is 0.8583/0.8559. The pattern width is measured
Open chart in a new window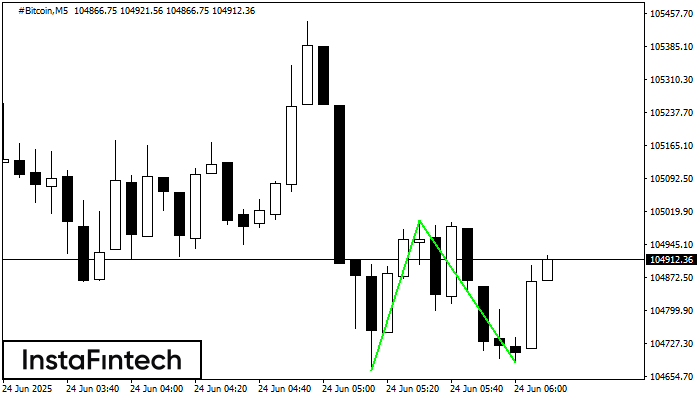
The Double Bottom pattern has been formed on #Bitcoin M5. This formation signals a reversal of the trend from downwards to upwards. The signal is that a buy trade should
The M5 and M15 time frames may have more false entry points.
Open chart in a new window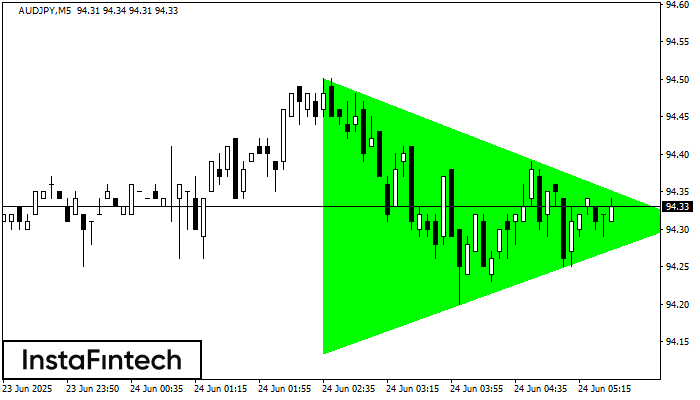
According to the chart of M5, AUDJPY formed the Bullish Symmetrical Triangle pattern. Description: This is the pattern of a trend continuation. 94.50 and 94.13 are the coordinates
The M5 and M15 time frames may have more false entry points.
Open chart in a new window


