signal strength 3 of 5
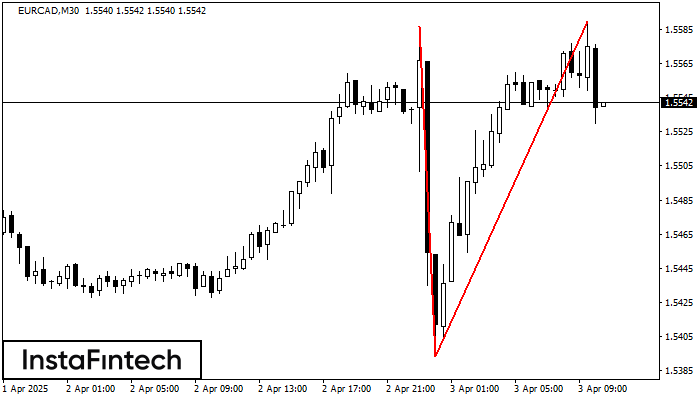
On the chart of EURCAD M30 the Double Top reversal pattern has been formed. Characteristics: the upper boundary 1.5590; the lower boundary 1.5393; the width of the pattern 197 points. The signal: a break of the lower boundary will cause continuation of the downward trend targeting the 1.5363 level.
- All
- Double Top
- Flag
- Head and Shoulders
- Pennant
- Rectangle
- Triangle
- Triple top
- All
- #AAPL
- #AMZN
- #Bitcoin
- #EBAY
- #FB
- #GOOG
- #INTC
- #KO
- #MA
- #MCD
- #MSFT
- #NTDOY
- #PEP
- #TSLA
- #TWTR
- AUDCAD
- AUDCHF
- AUDJPY
- AUDUSD
- EURCAD
- EURCHF
- EURGBP
- EURJPY
- EURNZD
- EURRUB
- EURUSD
- GBPAUD
- GBPCHF
- GBPJPY
- GBPUSD
- GOLD
- NZDCAD
- NZDCHF
- NZDJPY
- NZDUSD
- SILVER
- USDCAD
- USDCHF
- USDJPY
- USDRUB
- All
- M5
- M15
- M30
- H1
- D1
- All
- Buy
- Sale
- All
- 1
- 2
- 3
- 4
- 5
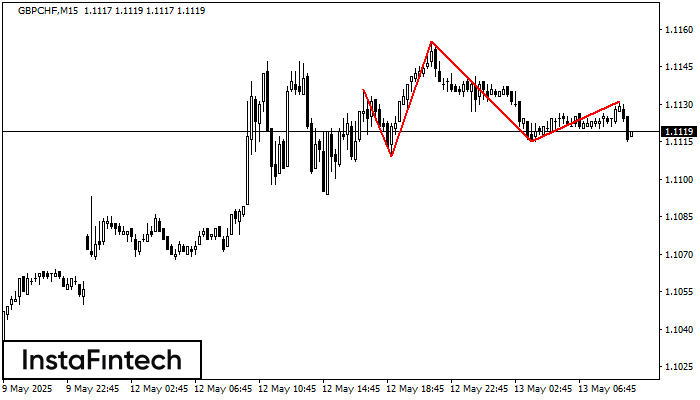
According to the chart of M15, GBPCHF formed the Head and Shoulders pattern. The Head’s top is set at 1.1155 while the median line of the Neck is found
The M5 and M15 time frames may have more false entry points.
Open chart in a new window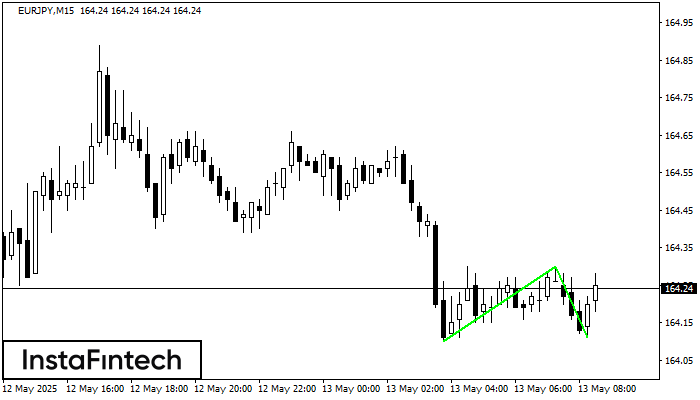
The Double Bottom pattern has been formed on EURJPY M15. Characteristics: the support level 164.10; the resistance level 164.30; the width of the pattern 20 points. If the resistance level
The M5 and M15 time frames may have more false entry points.
Open chart in a new window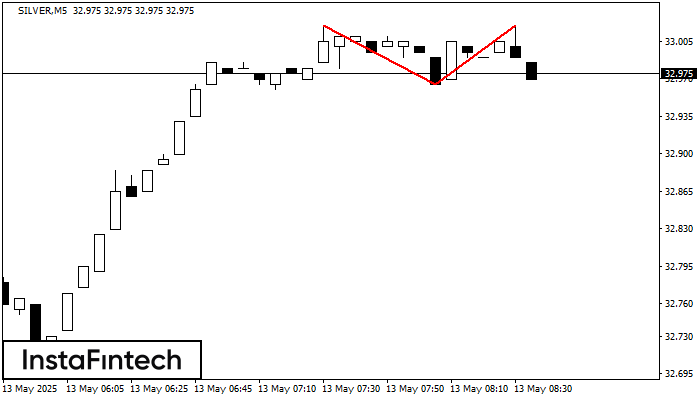
The Double Top reversal pattern has been formed on SILVER M5. Characteristics: the upper boundary 33.02; the lower boundary 32.97; the width of the pattern is 55 points. Sell trades
The M5 and M15 time frames may have more false entry points.
Open chart in a new window