empty
27.03.2024 03:03 PM
GBP/USD: trading scenarios on March 27, 2024

This image is no longer relevant

The results of the Bank of England's March meeting and comments from its leaders exerted pressure on the pound and the GBP/USD pair.

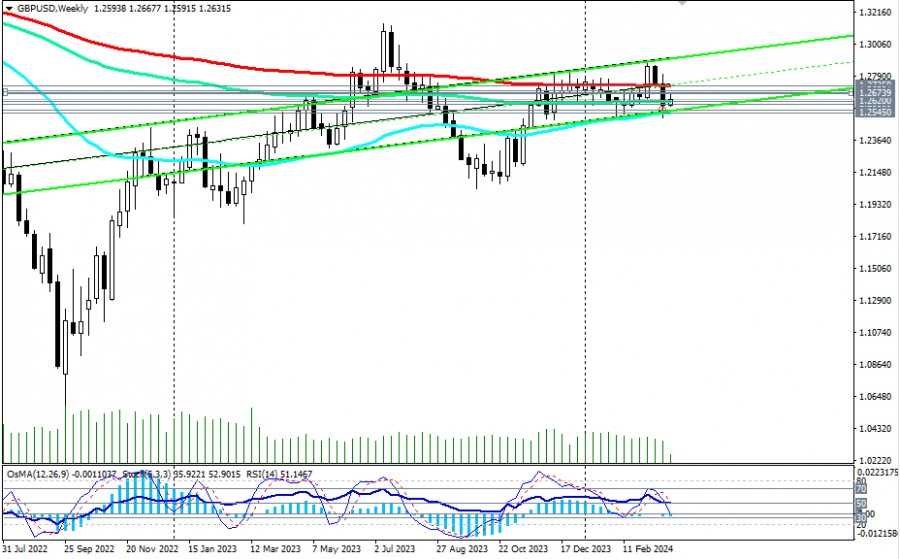
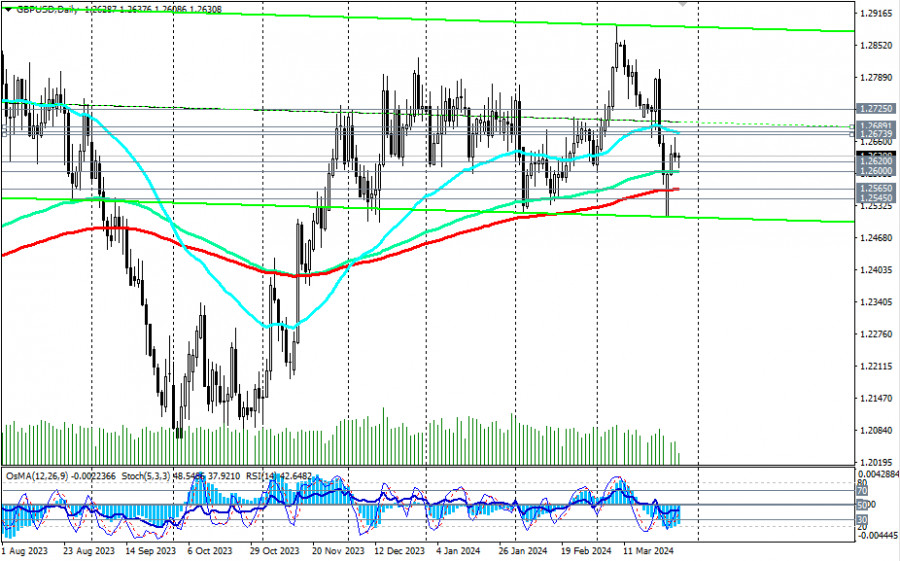
The next day, the pair tested key support levels for a breakthrough: 1.2565 (200 EMA on the daily chart) and 1.2545 (50 EMA on the weekly chart), separating the medium-term bullish market from the bearish one.

This image is no longer relevant

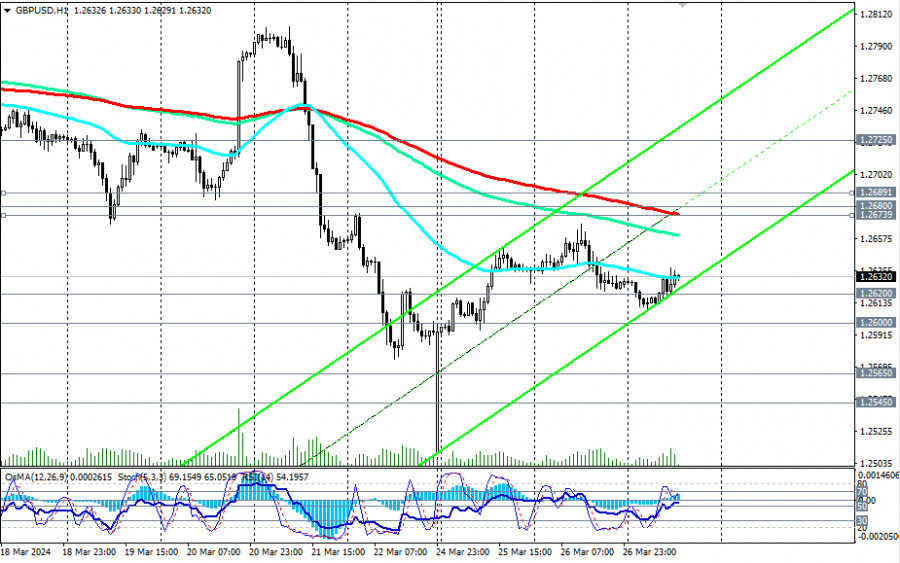
Subsequently, GBP/USD managed to recover somewhat, rising from a local low of 1.2510 to the resistance zone at levels 1.2674 (200 EMA on the 1-hour chart), 1.2680 (50 EMA on the daily chart), and 1.2689 (200 EMA on the 4-hour chart).

However, the corrective potential dried up near the 1.2667 mark, and GBP/USD resumed its decline.

This image is no longer relevant

Thus, as of this writing, it was trading near the 1.2632 mark, declining towards the important support level of 1.2600 (144 EMA on the daily chart).

At the same time, technical indicators such as OsMA, RSI, and Stochastic on the daily and weekly charts are favoring sellers, signaling the advantage of short positions.

A breakout below the key support level of 1.2600 could be the first signal for new medium-term short positions, with the breakout of key support levels of 1.2565 and 1.2545 confirming this.

Moreover, below the key resistance level of 1.2725, GBP/USD is in the long-term bearish market zone, giving preference to long-term short positions.

In an alternative scenario, if GBP/USD resumes its rise, it will again head towards the resistance zone near levels 1.2674, 1.2680, and 1.2690. Their breakout could trigger further growth towards the key resistance level of 1.2725. Its breakout, in turn, will lead the pair into the long-term bullish market zone, which would be the first signal for long-term long positions.

For now, the advantage lies with the shorts.

Support levels: 1.2600, 1.25656, 1.2545, 1.2500

Resistance levels: 1.2674, 1.2680, 1.2689, 1.2700, 1.2725, 1.2800, 1.2830, 1.2860, 1.2890, 1.2900, 1.3000, 1.3100, 1.3140

Trading Scenarios:

Main scenario: Sell Stop 1.2590. Stop-Loss 1.2655. Targets 1.25656, 1.2545, 1.2500

Alternative scenario: Buy Stop 1.2655. Stop-Loss 1.2590. Targets 1.2674, 1.2680, 1.2689, 1.2700, 1.2725, 1.2800, 1.2830, 1.2860, 1.2890, 1.2900, 1.3000, 1.3100, 1.3140

"Targets" correspond to support/resistance levels. This also does not mean that they will necessarily be reached, but they can serve as a guide when planning and placing trading positions.

Jurij Tolin,
Analytical expert of InstaForex
© 2007-2025
Select timeframe
5
min
15
min
30
min
1
hour
4
hours
1
day
1
week
Earn on cryptocurrency rate changes with InstaForex
Download MetaTrader 4 and open your first trade
  • Grand Choice
    Contest by
    InstaForex
    InstaForex always strives to help you
    fulfill your biggest dreams.
    JOIN CONTEST

Recommended Stories

Trading Recommendations and Analysis for GBP/USD on June 26: The Pound Calmly Awaits the Right Moment

The GBP/USD currency pair remained immobile for most of Thursday. Let's recall that the pair reached its three-year high this week, and even after this significant event, no correction began

Paolo Greco 03:39 2025-06-26 UTC+2

Trading Recommendations and Analysis for EUR/USD on June 26: Total Flat in an Empty Calendar

The EUR/USD currency pair showed absolutely no movement throughout Wednesday. Volatility was minimal. What's most interesting is that the flat occurred at the highest levels seen in three years

Paolo Greco 03:39 2025-06-26 UTC+2

GBP/USD: Trading Plan for the U.S. Session on June 25th (Review of Morning Trades)

In my morning forecast, I highlighted the 1.3591 level and planned to make trading decisions based on it. Let's look at the 5-minute chart and see what happened. The pair

Miroslaw Bawulski 18:25 2025-06-25 UTC+2

EUR/USD: Trading Plan for the U.S. Session on June 25th (Review of Morning Trades)

In my morning forecast, I highlighted the 1.1584 level and planned to make trading decisions based on it. Let's take a look at the 5-minute chart and analyze what happened

Miroslaw Bawulski 18:21 2025-06-25 UTC+2

How to Trade the GBP/USD Pair on June 25? Simple Tips and Trade Analysis for Beginners

Analysis of Tuesday's Trades 1H Chart of GBP/USD On Tuesday, the GBP/USD pair continued its upward movement, even stronger than the EUR/USD pair. The reason behind the new rise

Paolo Greco 06:36 2025-06-25 UTC+2

How to Trade the EUR/USD Pair on June 25? Simple Tips and Trade Analysis for Beginners

Analysis of Tuesday's Trades 1H Chart of EUR/USD The EUR/USD currency pair continued its upward movement on Tuesday overall. This time, the market witnessed an entire circus act performed

Paolo Greco 06:36 2025-06-25 UTC+2

Trading Recommendations and Analysis for GBP/USD on June 25: The Pound Did Not Follow the Euro's Lead

On Tuesday, the GBP/USD currency pair traded very differently from the EUR/USD pair, which is rare. The British pound rose not only on Monday evening but throughout the night

Paolo Greco 03:35 2025-06-25 UTC+2

Trading Recommendations and Analysis for EUR/USD on June 25: Technical Factors Unexpectedly Halted the Dollar's Decline

The EUR/USD currency pair traded relatively calmly throughout most of Tuesday, though there were still some "spikes." The first significant "spike" in recent days occurred Monday evening when the market

Paolo Greco 03:35 2025-06-25 UTC+2

GBP/USD: Plan for the U.S. Session on June 24th (Review of Morning Trades)

In my morning forecast, I highlighted the 1.3568 level and planned to use it to make market entry decisions. Let's take a look at the 5-minute chart to understand what

Miroslaw Bawulski 18:35 2025-06-24 UTC+2

EUR/USD: Trading Plan for the U.S. Session on June 24th (Review of Morning Trades)

In my morning forecast, I highlighted the 1.1579 level and planned to use it for making entry decisions. Let's look at the 5-minute chart and see what happened. The decline

Miroslaw Bawulski 18:31 2025-06-24 UTC+2
Can't speak right now?
Ask your question in the chat.
Widget callback
 

Dear visitor,

Your IP address shows that you are currently located in the USA. If you are a resident of the United States, you are prohibited from using the services of InstaFintech Group including online trading, online transfers, deposit/withdrawal of funds, etc.

If you think you are seeing this message by mistake and your location is not the US, kindly proceed to the website. Otherwise, you must leave the website in order to comply with government restrictions.

Why does your IP address show your location as the USA?

  • - you are using a VPN provided by a hosting company based in the United States;
  • - your IP does not have proper WHOIS records;
  • - an error occurred in the WHOIS geolocation database.

Please confirm whether you are a US resident or not by clicking the relevant button below. If you choose the wrong option, being a US resident, you will not be able to open an account with InstaForex anyway.

We are sorry for any inconvenience caused by this message.