empty
10.02.2025 08:40 AM
BTC/USD Analysis – February 10th

This image is no longer relevant

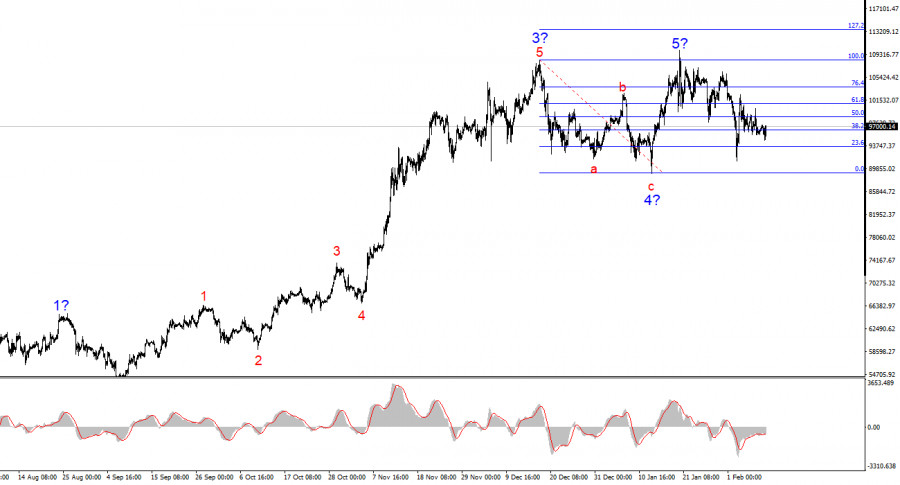
The wave structure on the 4-hour chart appears clear. Following a prolonged and complex corrective structure (a-b-c-d-e) that lasted from March 14 to August 5, a new impulse wave began forming. This impulse wave has already developed into a five-wave pattern. Based on the size of the first wave, the fifth wave may end up being shortened. Thus, I do not expect Bitcoin to rise above $110,000–$115,000 in the coming months.

Additionally, wave 4 has taken a three-wave form, which supports the accuracy of the current wave count. The news cycle has been supporting Bitcoin's growth due to continued institutional investments, interest from governments, and pension funds. However, Donald Trump's policies could push investors out of the market, and no trend lasts indefinitely. The current structure of wave 2 in wave 5 raises doubts about whether it is truly wave 2 in 5. I am inclined to believe that the bullish trend is nearing completion.

Bitcoin Stuck in a Limited Range

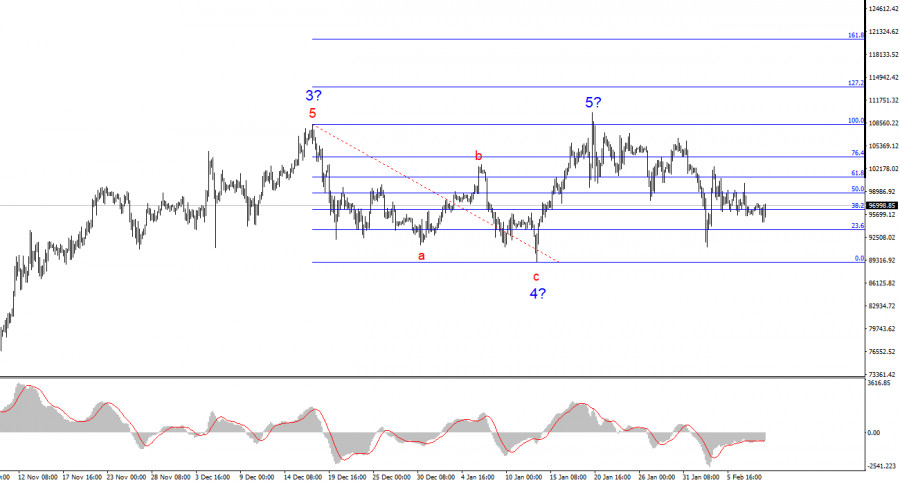
Over the weekend, BTC/USD remained stagnant. This time, Donald Trump was inactive, taking a break from policy decisions, so Monday did not start with another market shock. Price movement amplitude in recent days has been low, which many traders may find frustrating. I see no strong catalyst for renewed Bitcoin demand. The trend that started on January 20 appears corrective, which also rules out the likelihood of a sharp decline. After a six-month bullish rally, the market might be taking a break for a few months.

On Friday, key U.S. labor market and unemployment data were released, but their impact on Bitcoin market sentiment was minimal.

The crypto community continues to receive various news updates, but most of these are speculative opinions rather than solid fundamentals. Some analysts predict that Bitcoin could become a political tool under Donald Trump and expect it to drop to $70,000. Others believe Bitcoin will rise indefinitely, with a short-term target of $250,000.

Since December 17, Bitcoin has been moving sideways. In the near future, prices may decline to $90,000, forming a five-wave corrective structure (a-b-c-d-e). Only a successful breakout below $89,000 would signal that the market is ready to establish a new bearish trend.

This image is no longer relevant

General Conclusions

BTC/USD uptrend is nearing completion. This may not be a popular opinion, but wave 5 could be shortened. If this assumption is correct, we could see a sharp drop or a complex correction. I do not recommend buying Bitcoin at this stage. In the near future, Bitcoin could fall below wave 4's low, confirming the transition to a bearish trend.

On a higher wave scale, Bitcoin has formed a five-wave bullish structure. A corrective bearish wave or a new bearish trend could begin soon.

Key Principles of My Analysis:

  1. Wave structures should be simple and clear. Complex patterns are difficult to trade and frequently change.
  2. If you are uncertain about the market, it is better to stay out.
  3. Absolute certainty in price direction does not exist. Always use Stop Loss orders.
  4. Wave analysis should be combined with other analysis methods and trading strategies.
Chin Zhao,
Analytical expert of InstaForex
© 2007-2025
Select timeframe
5
min
15
min
30
min
1
hour
4
hours
1
day
1
week
Earn on cryptocurrency rate changes with InstaForex
Download MetaTrader 4 and open your first trade
  • Grand Choice
    Contest by
    InstaForex
    InstaForex always strives to help you
    fulfill your biggest dreams.
    JOIN CONTEST

Recommended Stories

Bitcoin aims to hit $120,000? What lies behind its rally and when to expect retracement

On May 22, Bitcoin confidently broke through the $111,888 level, setting a new all-time high of $111,867. Unlike previous rallies marked by retail investor euphoria, this time the market's behavior

Ekaterina Kiseleva 16:12 2025-05-22 UTC+2

Bitcoin extending confident rally

Bitcoin demand appears to be surging, judging by its recent performance. At the time of publication, the BTC/USD pair was trading near 111,200.00, slightly down from today's and the all-time

Jurij Tolin 16:02 2025-05-22 UTC+2

Bitcoin: $115,000 — Next Stop or Bull Trap?

Bitcoin is steadily approaching its all-time high and, according to several analysts, is poised to set a new record. Current levels near $105,000 are more than just numbers — they

Ekaterina Kiseleva 00:58 2025-05-21 UTC+2

BTC/USD Analysis on May 20, 2025

The wave pattern on the 4-hour chart for BTC/USD has been becoming more complex in recent months. We observed a corrective downward structure, which completed its formation around the 75,000

Chin Zhao 11:11 2025-05-20 UTC+2

Technical Analysis of Daily Price Movement of Ethereum Cryptocurrency, Friday May 16, 2025.

If we look at the 4-hour chart, the Ethereum cryptocurrency appears to be moving above the WMA (21) which is a dynamic support where the WMA has a slope that

Arief Makmur 06:09 2025-05-16 UTC+2

Technical Analysis of Intraday Price Movement of Uniswap Cryptocurrency, Friday May 16, 2025.

On the 4-hour chart, the Uniswap cryptocurrency appears to have a Descending Broadening Wedge pattern, so even though the Uniswap price movement is moving below the WMA (21) which

Arief Makmur 06:09 2025-05-16 UTC+2

Bitcoin spikes from $96 600 to $104 500 in 24 hours

Bitcoin has surged to $104,500, after trading at $96,600 just yesterday morning. This confident move above the $100,000 mark clearly signals a return of strong bullish momentum in the cryptocurrency

Jakub Novak 14:49 2025-05-09 UTC+2

Trading Recommendations for the Cryptocurrency Market on May 9

Bitcoin has climbed above $100,000, while Ethereum is trying to consolidate above $2,000. After yesterday's sharp rally, which continued during today's Asian session, Bitcoin is now trading at $103,000, having

Miroslaw Bawulski 09:46 2025-05-09 UTC+2

Technical Analysis of Intraday Price Movement Ethereum Cryptocurrency, Friday May 09, 2025.

If we look at the 4-hour chart of the Ethereum cryptocurrency, it appears that the price movement is moving above the WMA (30 Shift 2) which also has a slope

Arief Makmur 06:27 2025-05-09 UTC+2

Technical Analysis of Intraday Price Movement Bitcoin Cryptocurrency, Friday May 09, 2025.

On the 4-hour chart of the Bitcoin cryptocurrency, the Stochastic Oscillator indicator can be seen to be in Overbought conditions and is now preparing to Cross SELL and break below

Arief Makmur 06:27 2025-05-09 UTC+2
Can't speak right now?
Ask your question in the chat.
Widget callback
 

Dear visitor,

Your IP address shows that you are currently located in the USA. If you are a resident of the United States, you are prohibited from using the services of InstaFintech Group including online trading, online transfers, deposit/withdrawal of funds, etc.

If you think you are seeing this message by mistake and your location is not the US, kindly proceed to the website. Otherwise, you must leave the website in order to comply with government restrictions.

Why does your IP address show your location as the USA?

  • - you are using a VPN provided by a hosting company based in the United States;
  • - your IP does not have proper WHOIS records;
  • - an error occurred in the WHOIS geolocation database.

Please confirm whether you are a US resident or not by clicking the relevant button below. If you choose the wrong option, being a US resident, you will not be able to open an account with InstaForex anyway.

We are sorry for any inconvenience caused by this message.