empty
27.03.2025 09:31 AM
BTC/USD Analysis. March 27th. Bitcoin lacks growth potential

This image is no longer relevant

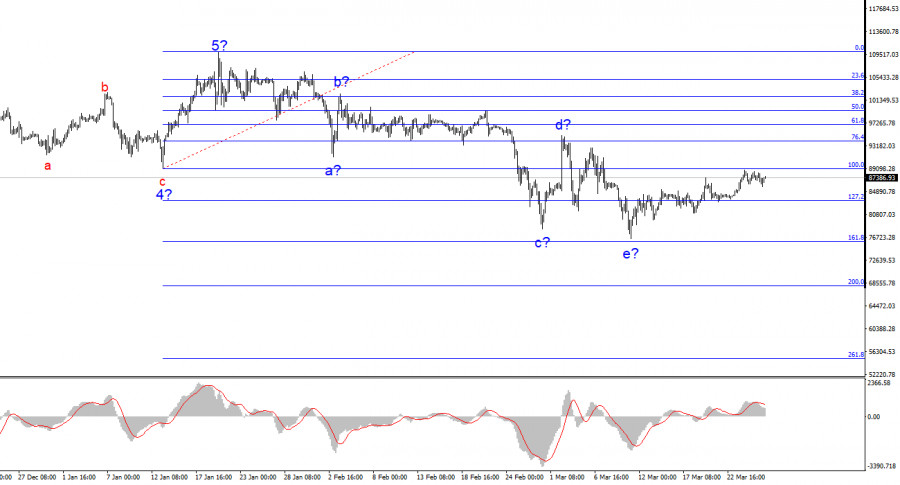
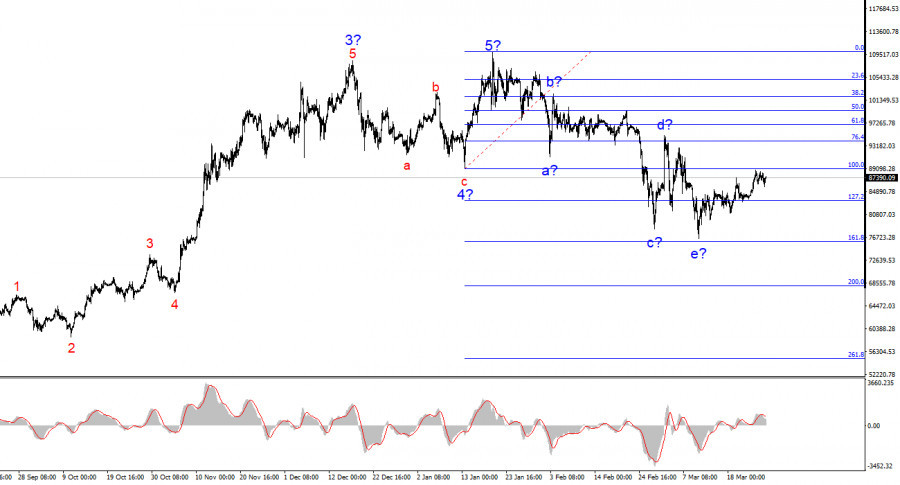
The wave structure on the 4-hour chart of BTC/USD is quite clear. After completing a bullish trend composed of five full waves, a corrective downward phase has begun, currently taking the form of a correction. Based on this, I did not expect, and still do not expect, Bitcoin to rise above $110,000–$115,000 in the coming months.

The news background had supported Bitcoin's growth thanks to continuous reports of new investments from institutional traders, governments of certain countries, and even pension funds. However, Trump and his policies have driven investors out of the market, and a trend cannot remain bullish indefinitely. The wave that began on January 20 does not resemble an impulsive wave. Therefore, we are likely dealing with a complex corrective structure that could unfold over several months. Within this initial wave, the structure is very complex, but the five-wave pattern a-b-c-d-e can be identified rather clearly. If the current wave structure is correct, then an upward corrective wave is now forming, which may classically consist of three waves.

The BTC/USD rate has managed to stabilize, and the wave structure now implies potential growth. But how strong could this rally realistically be? Many market participants begin to panic when Bitcoin drops $10,000 or $15,000. However, in my view, such a move is minor for a super-volatile asset like Bitcoin—this range can be covered in just a few days. From its all-time high, Bitcoin has already declined by $33,000. Even such a correction doesn't seem strong or deep enough to justify expecting a new bullish trend. Therefore, I anticipate the formation of a corrective wave or a series of waves, after which the broader corrective structure will likely continue to develop.

Currently, there is a lot of talk in the market about interest in Bitcoin from institutional investors and even the U.S. government. But let me remind you that interest in Bitcoin has been growing for years, and that has never stopped it from falling by tens of thousands of dollars during downtrends. I believe large players are using Bitcoin exactly as they should—to make a profit. Consequently, after an uptrend concludes, market participants begin taking profits. Prices fall, offering future opportunities to buy Bitcoin at lower levels. Nobody buys near all-time highs (except MicroStrategy).

This image is no longer relevant

Final conclusions

Based on the BTC/USD analysis, I conclude that the current growth phase has ended. Everything points toward a complex, multi-month correction ahead. This is why I've previously advised against buying cryptocurrencies—and now even more so. A drop in Bitcoin below the low of wave 4 indicates a transition to a bearish trend segment, likely corrective. Therefore, I believe the best course of action is to look for selling opportunities. A short-term corrective upward wave may develop soon, during which new selling opportunities can be considered, with targets around $68,000 and potentially down to $55,000.

On the higher wave scale, a five-wave bullish structure is visible. A corrective or full-fledged bearish trend structure is now forming.

Core Principles of My Analysis:

  1. Wave structures should be simple and clear. Complex formations are difficult to trade and often evolve unexpectedly.
  2. If you're unsure about the market situation, it's better to stay out.
  3. There is never 100% certainty about the direction. Always use protective Stop Loss orders.
  4. Wave analysis can be combined with other forms of analysis and trading strategies.
Chin Zhao,
Analytical expert of InstaForex
© 2007-2025
Select timeframe
5
min
15
min
30
min
1
hour
4
hours
1
day
1
week
Earn on cryptocurrency rate changes with InstaForex
Download MetaTrader 4 and open your first trade
  • Grand Choice
    Contest by
    InstaForex
    InstaForex always strives to help you
    fulfill your biggest dreams.
    JOIN CONTEST

Recommended Stories

Technical Analysis of Intraday Price Movement of Doge Cryptocurrency, Friday May 23, 2025.

It appears that the price movement of the Doge Cryptocurrency on the 4-hour chart is moving above the WMA (21) which has a slope that is going upwards

Arief Makmur 09:04 2025-05-23 UTC+2

Technical Analysis of Intraday Price Movement of Ripple Cryptocurrency, Friday May 23, 2025.

If we look at the 4-hour chart of the Ripple cryptocurrency, it appears to be moving above the WMA (21) which has a steep slope and has successfully broken

Arief Makmur 09:04 2025-05-23 UTC+2

Bitcoin Forecast for May 23, 2025

On Thursday, Bitcoin's price reached the target level of 111,770. The Marlin oscillator appears to be lagging behind the price, giving the impression of a potential divergence — though unconventional

Laurie Bailey 04:45 2025-05-23 UTC+2

Bitcoin aims to hit $120,000? What lies behind its rally and when to expect retracement

On May 22, Bitcoin confidently broke through the $111,888 level, setting a new all-time high of $111,867. Unlike previous rallies marked by retail investor euphoria, this time the market's behavior

Ekaterina Kiseleva 16:12 2025-05-22 UTC+2

Bitcoin extending confident rally

Bitcoin demand appears to be surging, judging by its recent performance. At the time of publication, the BTC/USD pair was trading near 111,200.00, slightly down from today's and the all-time

Jurij Tolin 16:02 2025-05-22 UTC+2

Bitcoin: $115,000 — Next Stop or Bull Trap?

Bitcoin is steadily approaching its all-time high and, according to several analysts, is poised to set a new record. Current levels near $105,000 are more than just numbers — they

Ekaterina Kiseleva 00:58 2025-05-21 UTC+2

BTC/USD Analysis on May 20, 2025

The wave pattern on the 4-hour chart for BTC/USD has been becoming more complex in recent months. We observed a corrective downward structure, which completed its formation around the 75,000

Chin Zhao 11:11 2025-05-20 UTC+2

Technical Analysis of Daily Price Movement of Ethereum Cryptocurrency, Friday May 16, 2025.

If we look at the 4-hour chart, the Ethereum cryptocurrency appears to be moving above the WMA (21) which is a dynamic support where the WMA has a slope that

Arief Makmur 06:09 2025-05-16 UTC+2

Technical Analysis of Intraday Price Movement of Uniswap Cryptocurrency, Friday May 16, 2025.

On the 4-hour chart, the Uniswap cryptocurrency appears to have a Descending Broadening Wedge pattern, so even though the Uniswap price movement is moving below the WMA (21) which

Arief Makmur 06:09 2025-05-16 UTC+2

Bitcoin spikes from $96 600 to $104 500 in 24 hours

Bitcoin has surged to $104,500, after trading at $96,600 just yesterday morning. This confident move above the $100,000 mark clearly signals a return of strong bullish momentum in the cryptocurrency

Jakub Novak 14:49 2025-05-09 UTC+2
Can't speak right now?
Ask your question in the chat.
Widget callback
 

Dear visitor,

Your IP address shows that you are currently located in the USA. If you are a resident of the United States, you are prohibited from using the services of InstaFintech Group including online trading, online transfers, deposit/withdrawal of funds, etc.

If you think you are seeing this message by mistake and your location is not the US, kindly proceed to the website. Otherwise, you must leave the website in order to comply with government restrictions.

Why does your IP address show your location as the USA?

  • - you are using a VPN provided by a hosting company based in the United States;
  • - your IP does not have proper WHOIS records;
  • - an error occurred in the WHOIS geolocation database.

Please confirm whether you are a US resident or not by clicking the relevant button below. If you choose the wrong option, being a US resident, you will not be able to open an account with InstaForex anyway.

We are sorry for any inconvenience caused by this message.