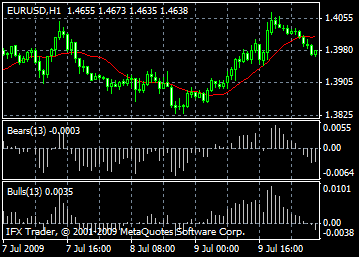
Unification of a trend retracing indicators and oscillators` features is called technical indicator Elder-Rays. Exponential moving average (EMA, the most appropriate period is 13)is used as tracing indicator; oscillators show the power of bulls and bears. For constructing a graph it is necessary to draw three diagrams: one is for price charts and EMA, and Bulls Power and Bears Power Oscillators are at the two others.

Elder-Rays can be used along with other methods as well as by itself.
Using them separately, you should take into account that EMA incline shows the trend direction and you should open positions along with it. Oscillators of bulls and bears power are used for detection of moment for opening/closing positions. Purchase is recommended if:
there is uptrend (detected by EMA direction);
there is negative but rising Oscillator of bears power;
the last peak of Bulls Power Oscillator is higher than the previous one;
Bears Power Oscillator rises after the bullish divergence;
Purchases should be minimized if Bears Power Oscillator has positive rates.
Selling is recommended if:
there is downtrend (detected by EMA direction);
Bulls Power Oscillator is positive but decreasing;
The last cavity of Bulls Power Oscillator is lower than the previous one;
Bulls Power Oscillator decreases coming out of bearish divergence.
It is not recommended to open short positions if Bulls Power Oscillator has negative values.
The most successful time for orders execution is divergence between Bulls Power and Bears Power and prices.


