empty
05.10.2021 07:29 AM
Elliott wave analysis of Amazon for October 5, 2021

This image is no longer relevant

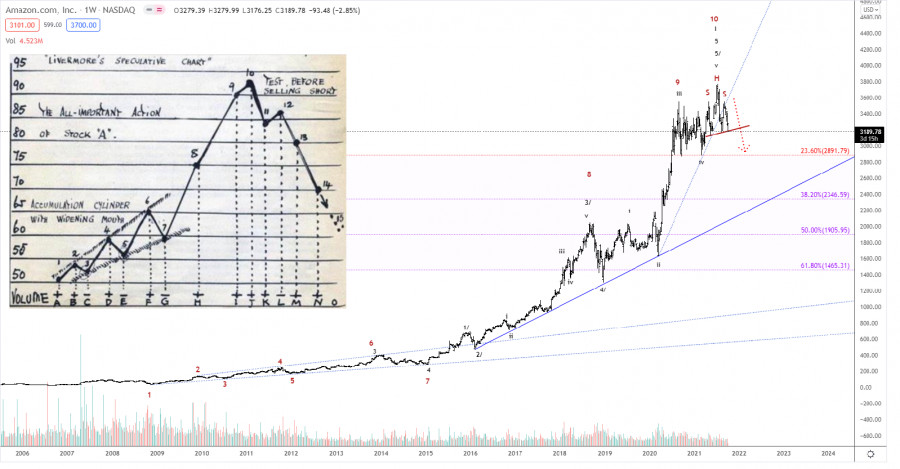
Amazon has completed Livermore's accumulation cylinder with the test of 3,760. It is also completing an S/H/S top indication. A long-term top is in place and a major correction is now unfolding to the key support area between 1,465 - 1,905. If so, a new long-term rally may occur.

In the short term, a break below the support level of 3,175 will activate the S/H/S top for a decline to the solid support at 2,891. Shortly after, it may consolidate at this level. However, it should just be a matter of time before the quote declines to 1,905.

Select timeframe
5
min
15
min
30
min
1
hour
4
hours
1
day
1
week
Earn on cryptocurrency rate changes with InstaForex
Download MetaTrader 4 and open your first trade
  • Grand Choice
    Contest by
    InstaForex
    InstaForex always strives to help you
    fulfill your biggest dreams.
    JOIN CONTEST

Recommended Stories

GBP/USD Analysis on May 13, 2025

The wave pattern for GBP/USD has also transformed into a bullish, impulsive structure — "thanks" to Donald Trump. The wave picture is almost identical to that of EUR/USD. Until February

Chin Zhao 18:37 2025-05-13 UTC+2

EUR/USD Analysis on May 13, 2025

The wave structure on the 4-hour chart for EUR/USD has transformed into a bullish pattern and remains such. There is little doubt that this shift was triggered exclusively

Chin Zhao 18:35 2025-05-13 UTC+2

EUR/USD Analysis on May 9, 2025

The wave structure on the 4-hour EUR/USD chart has transformed into a bullish pattern. I believe there's little doubt that this shift was driven solely by the new U.S. trade

Chin Zhao 19:19 2025-05-09 UTC+2

GBP/USD Analysis on May 9, 2025

The wave pattern for the GBP/USD instrument has also shifted into a bullish, impulsive structure—"thanks" to Donald Trump. The wave picture is almost identical to that of EUR/USD. Until February

Chin Zhao 19:16 2025-05-09 UTC+2

GBP/USD Analysis on May 8, 2025

The wave structure for GBP/USD has also transformed into a bullish, impulsive pattern—"thanks" to Donald Trump. The wave picture is nearly identical to that of EUR/USD. Until February

Chin Zhao 19:40 2025-05-08 UTC+2

EUR/USD Analysis on May 8, 2025

The wave pattern on the 4-hour chart for EUR/USD has transformed into a bullish structure. I believe there is little doubt that this transformation was triggered solely

Chin Zhao 19:33 2025-05-08 UTC+2

GBP/USD Analysis on May 7, 2025

The wave pattern for GBP/USD has also transformed into a bullish, impulsive structure—"thanks" to Donald Trump. The wave picture closely resembles that of EUR/USD. Until February 28, we observed

Chin Zhao 19:55 2025-05-07 UTC+2

EUR/USD Analysis on May 7, 2025

The wave pattern on the 4-hour chart for EUR/USD has transformed into a bullish structure. I believe there's little doubt that this transformation has occurred solely

Chin Zhao 19:51 2025-05-07 UTC+2

GBP/USD Analysis – May 6th: The Pound Ignores the BoE

The wave structure for the GBP/USD pair has also transitioned into a bullish, impulsive formation—"thanks" to Donald Trump. The wave picture is nearly identical to that of EUR/USD. Prior

Chin Zhao 19:06 2025-05-06 UTC+2

EUR/USD Analysis – May 6th: The Fed Maintains a Hawkish Stance

The wave pattern on the 4-hour EUR/USD chart has transitioned into a bullish structure. I believe there is little doubt that this transformation occurred solely due to the new trade

Chin Zhao 19:03 2025-05-06 UTC+2
Can't speak right now?
Ask your question in the chat.
Widget callback