empty
10.04.2024 12:31 PM
GBP/USD on April 10. USD does not rely on traders' support

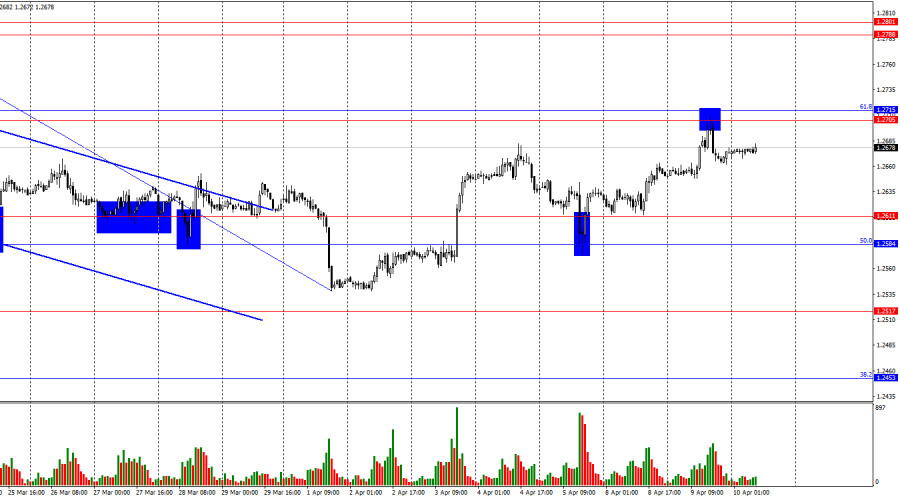
Hi, dear traders! On the 1-hour chart, the GBP/USD pair rose to the resistance zone of 1.2705–1.2715 and rebounded from it on Tuesday. The instrument made a reversal in favor of the US dollar. This allows us to expect some decline in the direction of the support zone of 1.2584–1.2611. If the price settle above the zone of 1.2705–1.2715, it will increase the likelihood of further growth towards the next zone 1.2788–1.2801.

This image is no longer relevant

The situation with waves recently has not raised any questions. The last completed bearish wave easily broke the last low (from March 19), and the new bullish wave is not yet strong enough to break through the last high from March 21. Thus, the trend for the GBP/USD pair is bearish, and there are no signs of its end. The first sign of the bulls going on the offensive could be a breakout of the high from March 21. But to reach the 1.2788-1.2801 zone, the bulls need to cover a distance of about 140 pips, which is unlikely to happen in the coming days. If a new downward wave does not break the low of April 1, this will also be a sign of a change in the trend to bullish, but this wave has not even begun yet.

There was no important news for the pound sterling and the US dollar on Tuesday. However, today a crucial report on inflation will be released in the US, which is already causing conflicting sentiment. On the one hand, inflation may accelerate again, which will arouse another wave of hawkish comments from FOMC policymakers. Any increase in hawkish expectations provides support to the US dollar, which has been going through hard times in recent months. On the other hand, the greenback did not grow in response to the US nonfarm payrolls released last week. Besides, the US dollar ignores the fact that the number of potential rate cuts in 2024 has been steadily declining. Last but not least, the US currency does not react with growth to any events at all. Thus, the bulls may continue to attack, even if inflation in the US turns out to be higher than traders' expectations.

This image is no longer relevant

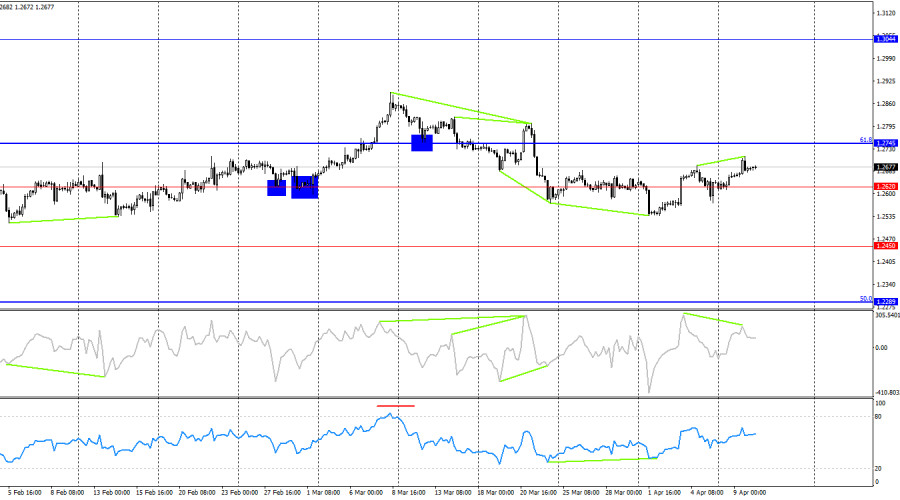
On the 4-hour chart, GBP/USD reversed in favor of the British pound after forming a bullish divergence at the RSI indicator and consolidation above the level of 1.2620. However, the bearish divergence of the CCI indicator enables us to expect a reversal in favor of the US dollar and some fall in the instrument. In my opinion, it will be short-lived. The bearish trend remains on the 1-hour chart, but on the 4-hour chart, the horizontal movement is going on.

Commitments of Traders Report (COT)

This image is no longer relevant

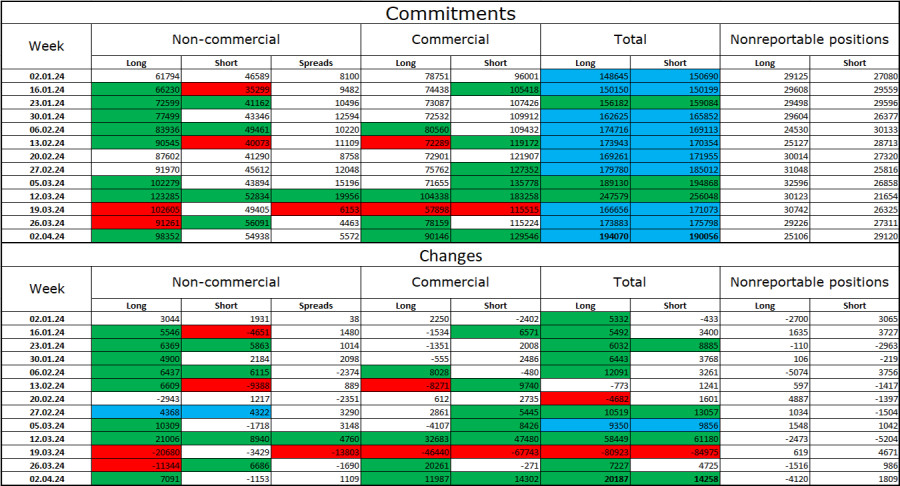
The sentiment of the non-commercial category of traders became a little more bullish over the last reporting week. The number of long contracts increased by 7,091, but the number of short contracts decreased by 1,153. The overall sentiment among major players remains bullish but has begun to weaken in recent weeks. The gap between the number of long and short contracts is already less than twofold: 98K versus 55K.

In my opinion, there are still prospects for the British pound to weaken, but over the past 3 months, the number of long contracts has increased from 61K to 98K, whereas the number of short contracts has remained virtually unchanged. I believe that over time, the bulls will begin to get rid of buy positions, since all possible factors for buying the British pound have already been worked out. However, the bears are still showing their weakness almost every week, which prevents the pound sterling from a downward move.

Economic calendar for US and UK

US: consumer price index due at 12-30 UTC

US: FOMC minutes due at 18-00 UTC

On Wednesday, the economic calendar contains two major reports. So, their influence of the information background over market sentiment will be strong today.

Outlook for GBP/USD and trading tips

Yesterday, short positions on the British pound could be opened on the condition of a dip from the zone of 1.2705– 1.2715 with the target at 1.2584–1.2611. Long positions were possible when GBP/USD closed above the 1.2584–1.2611 zone on the 1-hour chart with the target at 1.2705. This target was hit yesterday. Traders may open new buy positions when GBP/USD closes above the zone 1.2705–1.2715 with the target at 1.2788.

Samir Klishi,
Analytical expert of InstaForex
© 2007-2025
Select timeframe
5
min
15
min
30
min
1
hour
4
hours
1
day
1
week
Earn on cryptocurrency rate changes with InstaForex
Download MetaTrader 4 and open your first trade
  • Grand Choice
    Contest by
    InstaForex
    InstaForex always strives to help you
    fulfill your biggest dreams.
    JOIN CONTEST

Recommended Stories

Technical Analysis of Intraday Price Movement of AUD/JPY Cross Currency Pairs, Wednesday, April 23, 2025.

With the appearance of Divergence between the price movement of the AUD/JPY cross currency pair with the Stochastic Oscillator indicator and the price movement of AUD/JPY which is above

Arief Makmur 06:37 2025-04-23 UTC+2

Technical Analysis of Intraday Price Movement of Gold Commodity Instrument, Wednesday, April 23, 2025.

If we look at the 4-hour chart, the Gold commodity instrument appears to still be moving in a Bullish bias, but with the appearance of Divergence between the Gold price

Arief Makmur 06:37 2025-04-23 UTC+2

Forex forecast 22/04/2025: EUR/USD, GBP/USD, USD/JPY and Bitcoin

Useful links: My other articles are available in this section InstaForex course for beginners Popular Analytics Open trading account Important: The begginers in forex trading need to be very careful

Sebastian Seliga 10:08 2025-04-22 UTC+2

Technical Analysis of Intraday Price Movement of GBP/CHF Cross Currency Pairs, Tuesday April 22, 2025.

If we look at the 4-hour chart of the GBP/CHF cross currency pair, there are several interesting facts. First, the appearance of a Triangle pattern followed by the movement

Arief Makmur 06:58 2025-04-22 UTC+2

Technical Analysis of Intraday Price Movement of AUD/CAD Cross Currency Pairs, Tuesday April 22, 2025.

With the price movement of the AUD/CAD cross currency pair moving above the WMA (21) which has an upward slopes and the appearance of Convergence between the price movement

Arief Makmur 06:58 2025-04-22 UTC+2

Trading Signals for GOLD (XAU/USD) for April 21-25, 2025: sell below $3,422 (overbought - 8/8 Murray)

The eagle indicator has reached overbought levels. However, the metal could still reach the high around 8/8 Murray, which represents a strong barrier for gold. Below this area, we could

Dimitrios Zappas 17:23 2025-04-21 UTC+2

Technical Analysis of Intraday Price Movement EUR/GBP Cross Currency Pairs, Monday April 21, 2025

From what is seen on the 4-hour chart, the EUR/GBP cross currency pair appears to be moving above the EMA (100), which indicates that Buyers dominate the currency pair

Arief Makmur 04:19 2025-04-21 UTC+2

Technical Analysis of Intraday Price Movement USD/JPY Main Currency Pairs, Monday April 21, 2025.

With the appearance of Convergence between the price movement of the main currency pair USD/JPY with the Stochastic Oscillator indicator and the position of the EMA (100) which is above

Arief Makmur 04:19 2025-04-21 UTC+2

Forex forecast 18/04/2025: EUR/USD, GBP/USD, Gold and Bitcoin

Useful links: My other articles are available in this section InstaForex course for beginners Popular Analytics Open trading account Important: The begginers in forex trading need to be very careful

Sebastian Seliga 10:18 2025-04-18 UTC+2

Gold: Ongoing Uncertainty Continues to Support Gold Prices

Gold prices continue to receive support amid the fog of uncertainty surrounding the future course of the tariff wars initiated by Donald Trump. The price of gold has been climbing

Pati Gani 11:49 2025-04-17 UTC+2
Can't speak right now?
Ask your question in the chat.
Widget callback
 

Dear visitor,

Your IP address shows that you are currently located in the USA. If you are a resident of the United States, you are prohibited from using the services of InstaFintech Group including online trading, online transfers, deposit/withdrawal of funds, etc.

If you think you are seeing this message by mistake and your location is not the US, kindly proceed to the website. Otherwise, you must leave the website in order to comply with government restrictions.

Why does your IP address show your location as the USA?

  • - you are using a VPN provided by a hosting company based in the United States;
  • - your IP does not have proper WHOIS records;
  • - an error occurred in the WHOIS geolocation database.

Please confirm whether you are a US resident or not by clicking the relevant button below. If you choose the wrong option, being a US resident, you will not be able to open an account with InstaForex anyway.

We are sorry for any inconvenience caused by this message.