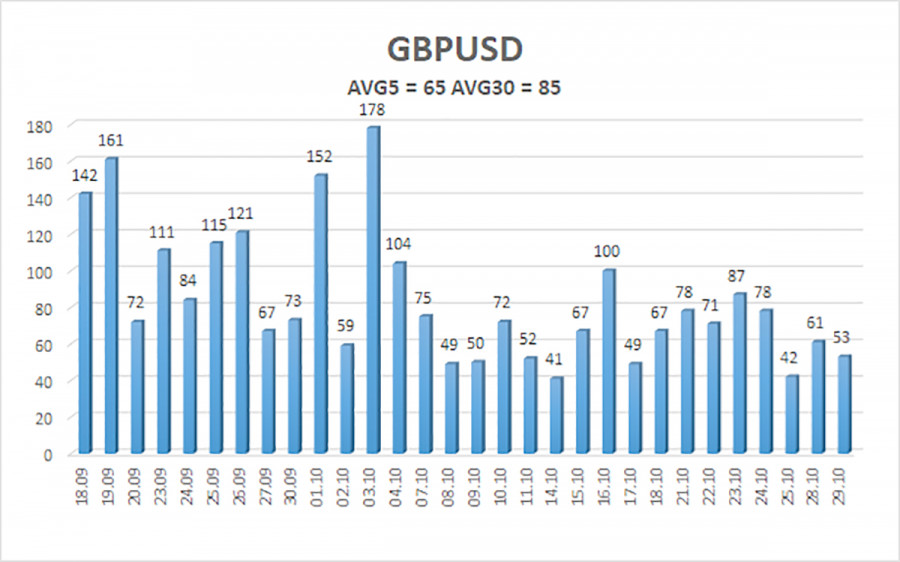
The GBP/USD currency pair again showed no significant movement on Tuesday. Volatility remained very low, as seen in the illustration below, and this issue extends beyond just Tuesday. For the past few weeks, the market has displayed extremely low activity. Trading any currency pair in such low volatility is challenging, as there are virtually no price movements. Waiting a couple of days for a 20-pip profit may suit some traders but not everyone.
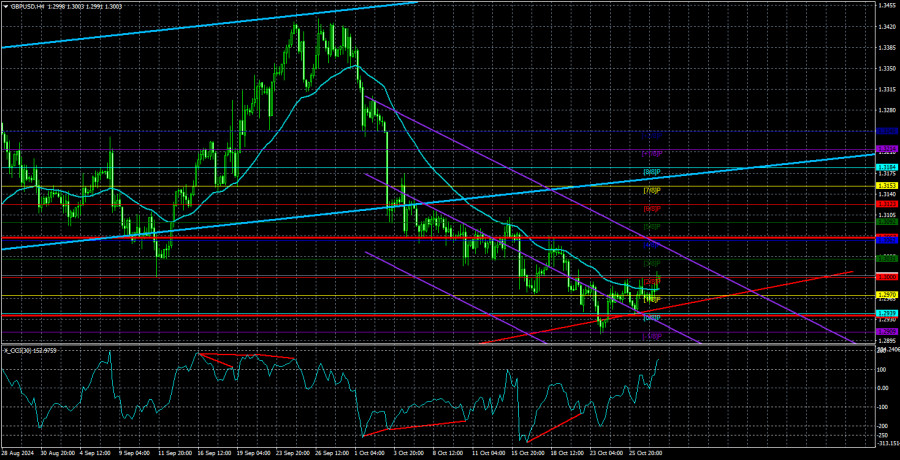
Given the current conditions, traders have a few options. Firstly, one could simply wait. Often, staying out of the market is the best decision. The situation is contradictory at the moment. On the one hand, the pound has been declining steadily for a month. On the other hand, the recent downtrend has been weak, with indications of an impending correction, bullish divergences, and overbought signals from indicators. Opening short positions is challenging amid so many signs suggesting potential upside.
It's essential to remember that indicators don't drive the market—market participants do—more specifically, large players or market makers. Here's a key question: who can prevent major players from continuing to sell the pound? The pound appreciated for two years, often raising questions about what was happening in the market. While any move can be explained in hindsight, that doesn't necessarily make it logical or justified.
Thus, this week's macroeconomic backdrop could significantly impact market sentiment, but reactions to it must be swift and real-time. It's impossible to predict the results of the NonFarm Payrolls or unemployment rate reports ahead of time. The technical outlook can be reassessed at the end of the week. Regardless, if an upward move does occur, it should be seen as a correction, which may be even slower than the previous impulsive move.
On the daily chart, the price has settled below the Ichimoku cloud, signaling a continuation of the medium-term downtrend. The Bank of England may soon resume its monetary easing cycle, as it has become the "lagging side." The market sold off the dollar for two years in anticipation of substantial Federal Reserve easing, and the situation has reversed. The BoE has only lowered rates once, and the longer it waits, the more aggressive future cuts may be.
Consequently, we still see no reason to buy the pound. Even if a medium-term uptrend resumes, it would likely be another illogical move, difficult to explain even in hindsight. Each trader must decide whether or not to participate in such movements.
The average volatility of the GBP/USD pair over the last five trading days is 65 pips, which is considered "average" for this pair. Therefore, on Wednesday, October 30, we expect movement within a range limited by 1.2937 and 1.3067. The higher linear regression channel is pointed upward, signaling an ongoing uptrend. The CCI indicator showed six bearish divergences before the decline started. Recently, the indicator entered the oversold zone and formed several bullish divergences, indicating a possible upward correction.
Nearest Support Levels:
- S1 – 1.2970
- S2 – 1.2939
- S3 – 1.2909
Nearest Resistance Levels:
- R1 – 1.3000
- R2 – 1.3031
- R3 – 1.3062
Trading Recommendations:
The GBP/USD currency pair maintains a downward trend. We still don't consider long positions, as we believe the market has already priced in all growth factors for the British currency. If you trade solely on technicals, longs with targets at 1.3062 and 1.3092 are possible if the price holds above the moving average. Short positions are much more relevant, with targets at 1.2909 and 1.2878, but a sustained move below the moving average is needed.
Explanation of Illustrations:
Linear Regression Channels help determine the current trend. If both channels are aligned, it indicates a strong trend.
Moving Average Line (settings: 20,0, smoothed) defines the short-term trend and current trading direction.
Murray Levels act as target levels for movements and corrections.
Volatility Levels (red lines) represent the likely price range for the pair over the next 24 hours based on current volatility readings.
CCI Indicator: If it enters the oversold region (below -250) or overbought region (above +250), it signals an impending trend reversal in the opposite direction.


