empty
19.03.2025 06:36 AM
EUR/USD and GBP/USD March 19 – Technical Analysis

EUR/USD

This image is no longer relevant

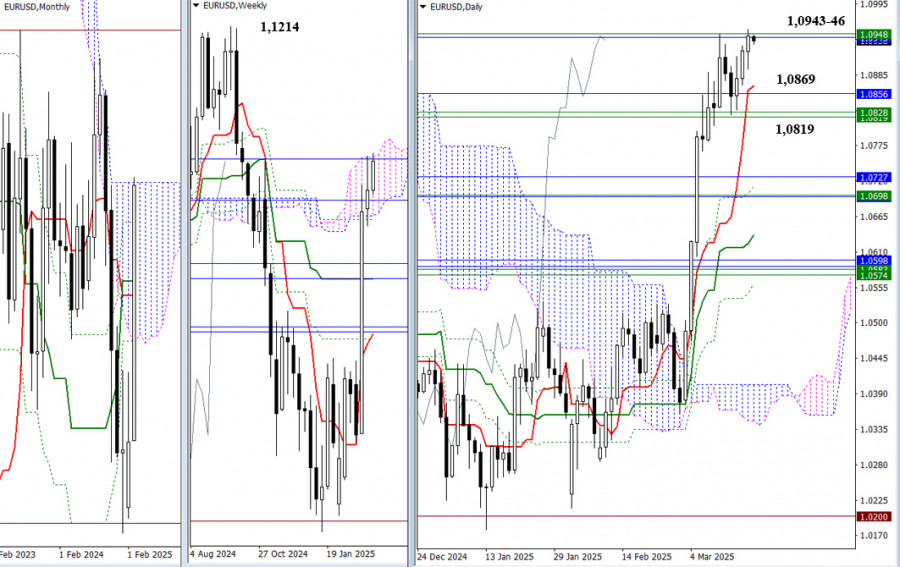
The pair is currently testing the upper boundaries of the monthly Ichimoku cloud at 1.0943 and the weekly cloud at 1.0946. If buyers can consolidate in the bullish zone relative to these clouds, they will open up new opportunities and set upward targets to break through the cloud. The next bullish targets are the nearest extreme highs at 1.1214 and 1.1276. However, if the current resistance levels (1.0943-1.0946) are able to push the market back again, as it did last week, we could see a pullback and a daily downward correction that brings the price back toward the support cluster around 1.0819 to 1.0856, as well as the daily short-term trend at 1.0869. Consolidation below these levels would shift sentiment on the weekly timeframe, causing the pair to return to the bearish zone relative to the weekly cloud.

This image is no longer relevant

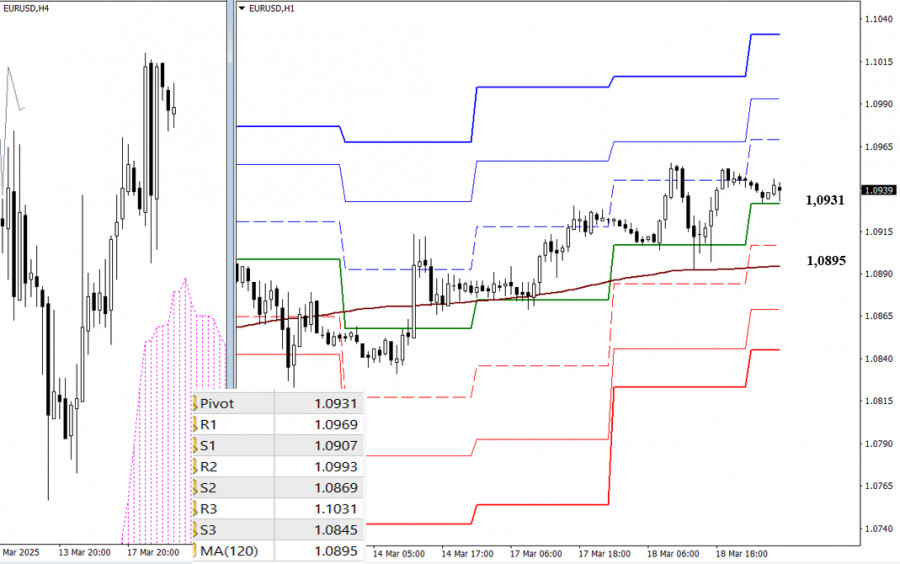
On lower timeframes, bulls currently have the advantage. Key levels for further upward movement today are 1.0969, 1.0993, and 1.1031, which are resistance levels based on classic Pivot points. If the current support at the central Pivot level (1.0931) is broken and a downward corrective move develops, the most significant test will be the long-term weekly trend at 1.0895. A breakout and reversal of this trend could shift the balance of power toward a stronger bearish sentiment. Additional intraday bearish targets include the classic Pivot support levels at 1.0907, 1.0869, and 1.0845.

***

GBP/USD

This image is no longer relevant

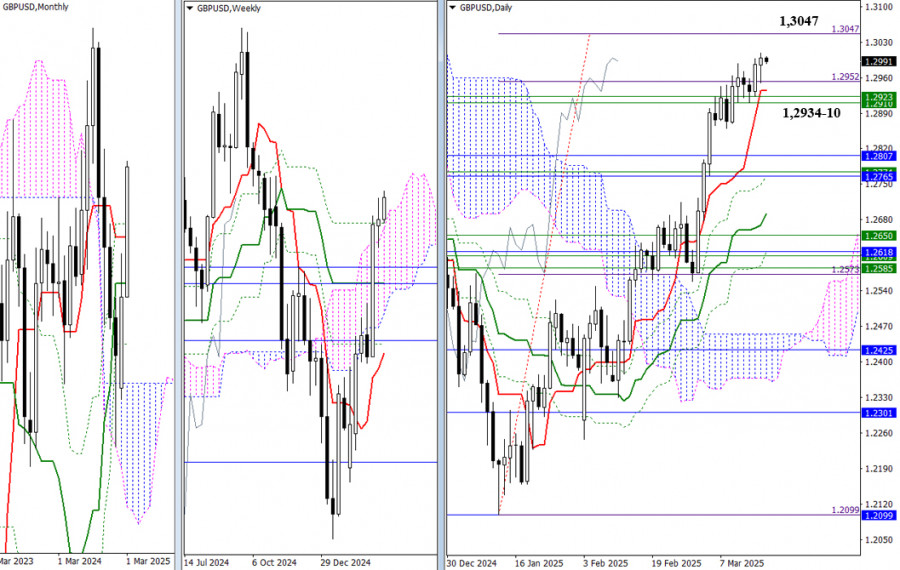
The currency pair has recently updated last week's high of 1.2988 and continues to rise gradually. The next target is the 100% completion level at 1.3047. If it successfully reaches the daily breakout target of the cloud and consolidates above this level, buyers will have the opportunity to explore new bullish prospects. However, if there is another failure, the market could retrace toward the support cluster at 1.2934, 1.2923, and 1.2910, which align with daily short-term trends and weekly levels. A firm consolidation below these levels could foster a bearish sentiment.

This image is no longer relevant

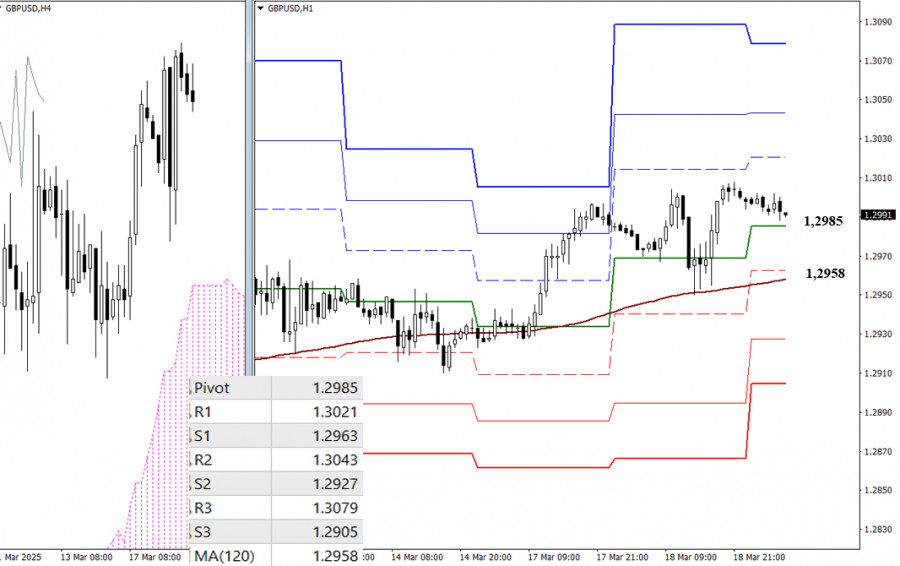
On lower timeframes, bulls currently maintain the upper hand. If the upward movement persists, key levels to monitor for breakouts include the classic Pivot resistance levels at 1.3021, 1.3043, and 1.3079. Conversely, if a correction gains momentum, the most critical level to test and break would be the long-term weekly trend at 1.2958. A shift in focus toward the downside could reinforce the bearish sentiment and create new opportunities for sellers, with additional support levels at 1.2927 and 1.2905, based on Pivot levels.

***

Technical Analysis Components:
  • Higher Timeframes: Ichimoku Kinko Hyo (9.26.52) and Fibonacci Kijun levels
  • H1: Classic Pivot Points and 120-period Moving Average (weekly long-term trend)
Evangelos Poulakis,
Analytical expert of InstaForex
© 2007-2025
Select timeframe
5
min
15
min
30
min
1
hour
4
hours
1
day
1
week
Earn on cryptocurrency rate changes with InstaForex
Download MetaTrader 4 and open your first trade
  • Grand Choice
    Contest by
    InstaForex
    InstaForex always strives to help you
    fulfill your biggest dreams.
    JOIN CONTEST

Recommended Stories

Technical Analysis of Intraday Price Movement of AUD/JPY Cross Currency Pairs, Wednesday, April 23, 2025.

With the appearance of Divergence between the price movement of the AUD/JPY cross currency pair with the Stochastic Oscillator indicator and the price movement of AUD/JPY which is above

Arief Makmur 06:37 2025-04-23 UTC+2

Technical Analysis of Intraday Price Movement of Gold Commodity Instrument, Wednesday, April 23, 2025.

If we look at the 4-hour chart, the Gold commodity instrument appears to still be moving in a Bullish bias, but with the appearance of Divergence between the Gold price

Arief Makmur 06:37 2025-04-23 UTC+2

Forex forecast 22/04/2025: EUR/USD, GBP/USD, USD/JPY and Bitcoin

Useful links: My other articles are available in this section InstaForex course for beginners Popular Analytics Open trading account Important: The begginers in forex trading need to be very careful

Sebastian Seliga 10:08 2025-04-22 UTC+2

Technical Analysis of Intraday Price Movement of GBP/CHF Cross Currency Pairs, Tuesday April 22, 2025.

If we look at the 4-hour chart of the GBP/CHF cross currency pair, there are several interesting facts. First, the appearance of a Triangle pattern followed by the movement

Arief Makmur 06:58 2025-04-22 UTC+2

Technical Analysis of Intraday Price Movement of AUD/CAD Cross Currency Pairs, Tuesday April 22, 2025.

With the price movement of the AUD/CAD cross currency pair moving above the WMA (21) which has an upward slopes and the appearance of Convergence between the price movement

Arief Makmur 06:58 2025-04-22 UTC+2

Trading Signals for GOLD (XAU/USD) for April 21-25, 2025: sell below $3,422 (overbought - 8/8 Murray)

The eagle indicator has reached overbought levels. However, the metal could still reach the high around 8/8 Murray, which represents a strong barrier for gold. Below this area, we could

Dimitrios Zappas 17:23 2025-04-21 UTC+2

Technical Analysis of Intraday Price Movement EUR/GBP Cross Currency Pairs, Monday April 21, 2025

From what is seen on the 4-hour chart, the EUR/GBP cross currency pair appears to be moving above the EMA (100), which indicates that Buyers dominate the currency pair

Arief Makmur 04:19 2025-04-21 UTC+2

Technical Analysis of Intraday Price Movement USD/JPY Main Currency Pairs, Monday April 21, 2025.

With the appearance of Convergence between the price movement of the main currency pair USD/JPY with the Stochastic Oscillator indicator and the position of the EMA (100) which is above

Arief Makmur 04:19 2025-04-21 UTC+2

Forex forecast 18/04/2025: EUR/USD, GBP/USD, Gold and Bitcoin

Useful links: My other articles are available in this section InstaForex course for beginners Popular Analytics Open trading account Important: The begginers in forex trading need to be very careful

Sebastian Seliga 10:18 2025-04-18 UTC+2

Gold: Ongoing Uncertainty Continues to Support Gold Prices

Gold prices continue to receive support amid the fog of uncertainty surrounding the future course of the tariff wars initiated by Donald Trump. The price of gold has been climbing

Pati Gani 11:49 2025-04-17 UTC+2
Can't speak right now?
Ask your question in the chat.
Widget callback
 

Dear visitor,

Your IP address shows that you are currently located in the USA. If you are a resident of the United States, you are prohibited from using the services of InstaFintech Group including online trading, online transfers, deposit/withdrawal of funds, etc.

If you think you are seeing this message by mistake and your location is not the US, kindly proceed to the website. Otherwise, you must leave the website in order to comply with government restrictions.

Why does your IP address show your location as the USA?

  • - you are using a VPN provided by a hosting company based in the United States;
  • - your IP does not have proper WHOIS records;
  • - an error occurred in the WHOIS geolocation database.

Please confirm whether you are a US resident or not by clicking the relevant button below. If you choose the wrong option, being a US resident, you will not be able to open an account with InstaForex anyway.

We are sorry for any inconvenience caused by this message.