GBP/USD 5-Minute Analysis
The GBP/USD currency pair continued its upward movement on Monday as it did last week. The only difference was the strength of the movement. On Monday, volatility was very high—without any clear macroeconomic or fundamental reasons. Donald Trump did not introduce any new tariffs or issue any new threats. There were no important reports or speeches in the UK or the US throughout the day. However, while Monday's upward movement in the euro looked somewhat surprising, the pound's behavior no longer surprises anyone. While the euro traded sideways all last week, the pound sterling steadily rose, as usual, ignoring all factors favoring the dollar. On Monday, there were no changes to the British currency, but the one-sided movement slightly intensified.
Although prices are moving in only one direction, it's impossible to construct a trendline for the current movement. Let's recall that a trendline is a support line. Thus, it must be built on two or more lows. But how can there be any lows if the price moves in only one direction without any correction?
Monday's trading signals left much to be desired—but the levels themselves weren't to blame. The strong rally began overnight from the 1.3273 level. Anyone awake at the time could have acted on that buy signal. The next two buy signals formed before the European session opened, near the 1.3367 level. However, by that point, the upward impulse had already begun to fade. Those signals could have made a small profit, but most of the growth occurred during the Asian session.
COT Report
COT (Commitments of Traders) reports on the British pound show that sentiment among commercial traders has been constantly shifting over recent years. The red and blue lines, representing net positions of commercial and non-commercial traders, frequently intersect and are usually close to the zero mark. This is still the case now, which indicates a roughly equal number of long and short positions.
On the weekly timeframe, the price first broke through the 1.3154 level, then overcame the trendline, returned to 1.3154, and broke it again. The breach of the trendline would typically suggest a high likelihood of further pound declines. However, we continue to see the dollar falling due to Donald Trump. Therefore, trade war news may keep pushing the pound even higher, regardless of the technical picture.
According to the latest COT report on the British pound, the "Non-commercial" group closed 6,000 BUY contracts and opened 4,700 SELL contracts. As a result, the net position of non-commercial traders has declined for the third consecutive week (-10,700 contracts), yet this hasn't had any meaningful impact on price movement.
The fundamental background still doesn't support long-term buying of the British pound, and the currency has realistic chances of continuing its long-term downtrend. The pound has risen sharply in recent months, but the reason is apparent: Trump's policy actions.
GBP/USD 1-Hour Analysis
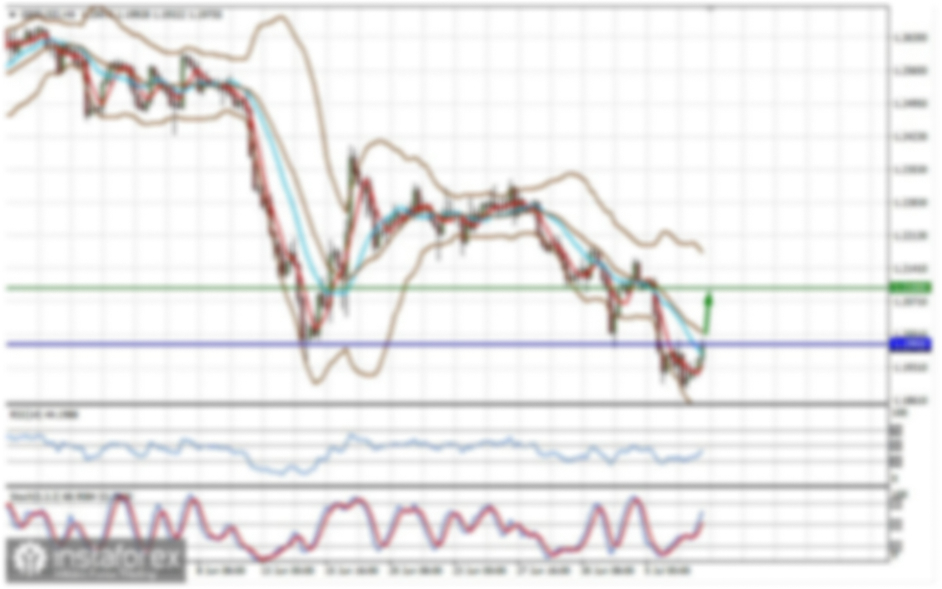
In the hourly timeframe, the GBP/USD pair showed a strong "surge" after nearly a month of flat movement, followed by an even more substantial drop and an even sharper "surge" that continued for two weeks. The British pound is rising again, although it has no merit. The entire upward movement of the pound results from the dollar's decline, triggered by Trump. And it is not over yet. Thus, chaos, uncertainty, and panic persist in the market, while logic and consistency in price movements remain absent.
For April 22, we highlight the following key levels: 1.2691–1.2701, 1.2796–1.2816, 1.2863, 1.2981–1.2987, 1.3050, 1.3125, 1.3212, 1.3288, 1.3358, 1.3439, 1.3489, 1.3537. The Senkou Span B line (1.3000) and Kijun-sen (1.3310) can also serve as signal sources. Setting the Stop Loss level to breakeven once the price moves 20 pips in the right direction is recommended. Ichimoku indicator lines may shift during the day, which should be considered when identifying trading signals.
No important events or reports are scheduled for Tuesday in the UK or the US. The British pound continues to rise, but this movement won't last forever. In any case, one must be ready for anything.
Illustration Explanations:
- Support and Resistance Levels (thick red lines): Thick red lines indicate where movement may come to an end. Please note that these lines are not sources of trading signals.
- Kijun-sen and Senkou Span B Lines: Ichimoku indicator lines transferred from the 4-hour timeframe to the hourly timeframe. These are strong lines.
- Extreme Levels (thin red lines): Thin red lines where the price has previously bounced. These serve as sources of trading signals.
- Yellow Lines: Trendlines, trend channels, or any other technical patterns.
- Indicator 1 on COT Charts: Represents the net position size for each category of traders.