empty
11.11.2024 04:56 PM
EUR/USD: November 11. Conditions Favorable for Dollar Appreciation

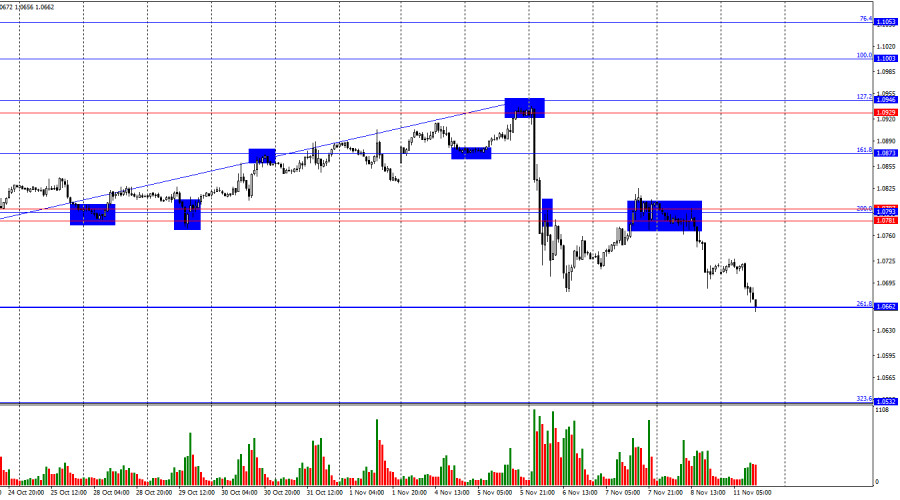
On Friday, the EUR/USD pair rebounded from the resistance zone of 1.0781–1.0797 and began a new downward movement. Within less than a day, the bears pushed the pair to the Fibonacci retracement level of 261.8% at 1.0662. A rebound from this level could support the euro and prompt a moderate recovery. However, consolidation below this level increases the likelihood of further declines toward the Fibonacci level of 323.6% at 1.0532.

This image is no longer relevant

The wave structure is straightforward and leaves no room for doubt. The last completed upward wave failed to surpass the peak of the previous wave, while the recent downward wave easily broke through the previous low. This confirms the ongoing formation of a bearish trend.

The corrective wave appears complete, and bulls have lost all market initiative. Regaining control would require significant effort, which appears improbable in the near term.

Despite a weak fundamental background on Friday, bears maintained momentum. After the U.S. election results and Federal Reserve meeting, bearish sentiment persisted. The bearish trend has been in place for two months, providing ample support for the dollar's growth and the euro's continued decline.

Additionally, the University of Michigan Consumer Sentiment Index exceeded trader expectations, offering further support to the bears. While the recent U.S. labor market report was weak, market expectations for the next one to two years remain pivotal.

Previously, the market anticipated Federal Reserve easing, but attention has shifted to potential easing from the ECB and the Bank of England. Meanwhile, the potential for higher U.S. inflation could prompt the Federal Reserve to raise rates, further supporting the dollar. In this context, the EUR/USD pair is likely to continue its downward trajectory.

This image is no longer relevant

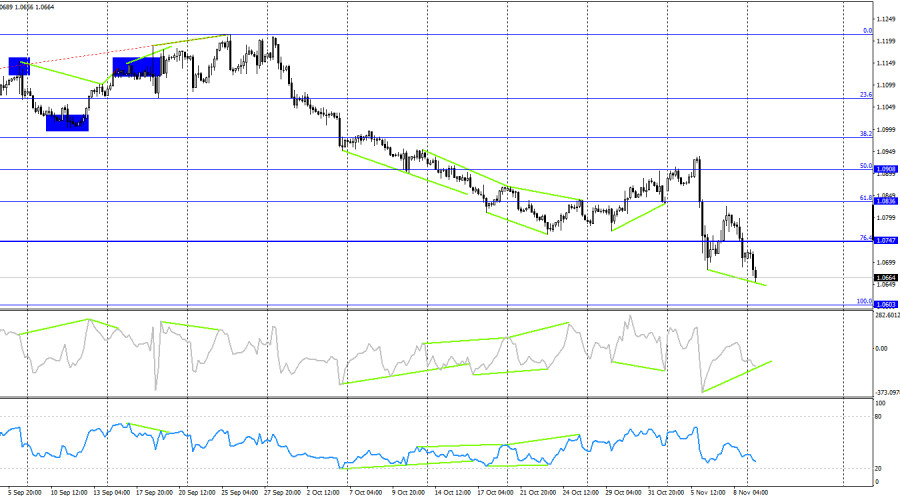
On the 4-hour chart, the pair reversed in favor of the U.S. dollar, consolidating below the 76.4% corrective level at 1.0747. This paves the way for further declines toward the next corrective level of 100.0% at 1.0603.

The CCI indicator is signaling a potential bullish divergence, which may indicate a short-term recovery. However, recent bullish divergences have failed to yield significant upward movements. For now, the technical picture does not justify a sustained euro rally.

Commitments of Traders (COT) Report

This image is no longer relevant

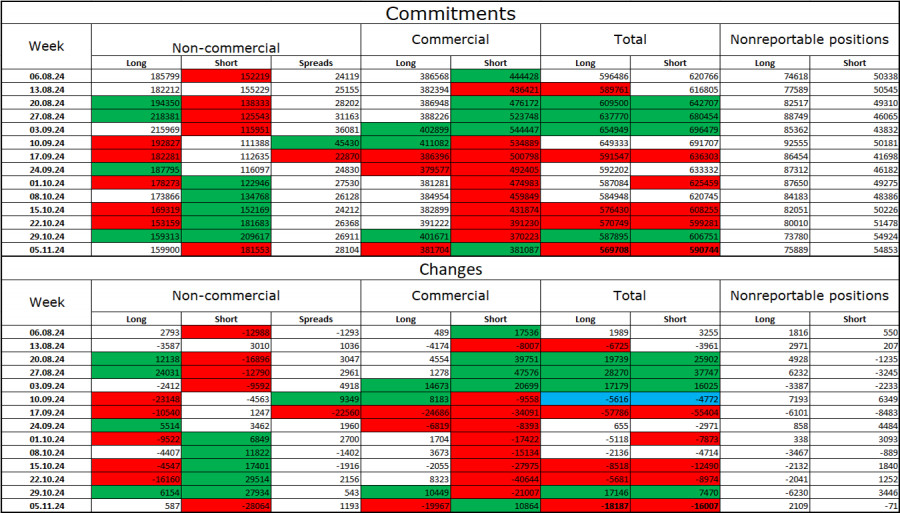
In the latest reporting week, speculators opened 587 long positions and closed 28,064 short positions. The Non-commercial group's sentiment has shifted to bearish. Speculators now hold 160,000 long positions compared to 181,000 short positions.

For eight consecutive weeks, large players have been reducing euro holdings. This likely signals the start of a bearish trend or a significant global correction. The primary factor driving previous dollar weakness—expectations of Federal Reserve easing—has been fully priced in. As a result, the dollar remains well-supported, and further growth appears likely.

Economic Calendar

The economic calendar for November 11 contains no significant events. Market sentiment is unlikely to be influenced by news today.

EUR/USD Forecast and Trading Advice

Selling opportunities emerged after a rebound from the 1.0781–1.0797 zone on the hourly chart, with a target at 1.0662, which has been achieved. Consolidation below this level allows traders to maintain short positions targeting 1.0532.

Buying opportunities may arise from a rebound at 1.0662. However, given the current weakness of the bulls, conservative targets are advisable.

Fibonacci Levels

  • Hourly Chart: Built between 1.1003 and 1.1214.
  • 4-Hour Chart: Built between 1.0603 and 1.1214.
Samir Klishi,
InstaForex के विश्लेषणात्मक विशेषज्ञ
© 2007-2025
समय सीमा चुनें
5
मिनट
15
मिनट
30
मिनट
1
घंटा
4
घंटे
1
दिन
1
सप्ताह
Earn on cryptocurrency rate changes with InstaForex
Download MetaTrader 4 and open your first trade
  • Grand Choice
    Contest by
    InstaForex
    InstaForex always strives to help you
    fulfill your biggest dreams.
    कॉन्टेस्ट में हिस्सा लें

अनुशंसित लेख

नैस्डैक 100 इंडेक्स की कीमत की चाल का तकनीकी विश्लेषण, गुरुवार, 24 अप्रैल 2025।

हालांकि 4-घंटे के चार्ट पर नैस्डैक 100 इंडेक्स साइडवेज़ (रुका हुआ) है, लेकिन इसका रेंज काफ़ी बड़ा है जिससे इंडेक्स में अभी भी एक काफ़ी आशाजनक अवसर मौजूद है। फिलहाल

Arief Makmur 06:56 2025-04-24 UTC+2

चांदी कमोडिटी इंस्ट्रूमेंट की मूल्य गति का तकनीकी विश्लेषण – गुरुवार, 24 अप्रैल 2025।

4-घंटे के चार्ट पर, चांदी कमोडिटी इंस्ट्रूमेंट की स्थिति मजबूत होती दिखाई दे रही है, जिसकी पुष्टि इस बात से होती है कि चांदी की कीमत WMA (30 शिफ्ट 2)

Arief Makmur 06:54 2025-04-24 UTC+2

ऑस्ट्रेलियन डॉलर/जापानी येन (AUD/JPY) क्रॉस करेंसी पेयर की इंट्राडे मूल्य आंदोलन का तकनीकी विश्लेषण, बुधवार, 23 अप्रैल, 2025।

स्टोकास्टिक ऑस्सीलेटर इंडिकेटर और AUD/JPY की मूल्य आंदोलन में डाइवर्जेंस के दिखाई देने के साथ, और AUD/JPY का मूल्य WMA (30 शिफ्ट 2) के ऊपर स्थित है, जो कि

Arief Makmur 11:16 2025-04-23 UTC+2

इंट्राडे मूल्य आंदोलन का तकनीकी विश्लेषण USD/JPY मुख्य करेंसी जोड़े, सोमवार 21 अप्रैल, 2025

मुख्य मुद्रा जोड़ी USD/JPY के मूल्य आंदोलन में स्टोकेस्टिक ऑस्सीलेटर संकेतक के साथ अभिसरण तथा EMA (100) की स्थिति जो मूल्य से ऊपर है, के प्रकट होने पर, निकट भविष्य

Arief Makmur 06:16 2025-04-21 UTC+2

इंट्राडे मूल्य आंदोलन का तकनीकी विश्लेषण EUR/GBP क्रॉस करेंसी जोड़े, सोमवार 21 अप्रैल, 2025

4-घंटे के चार्ट पर दिखाई दे रहा है कि EUR/GBP क्रॉस करेंसी जोड़ी EMA (100) के ऊपर चल रही है, जो दर्शाता है कि इस जोड़ी पर खरीदारों का प्रभुत्व

Arief Makmur 06:14 2025-04-21 UTC+2

USD/CAD का पूर्वानुमान 17 अप्रैल, 2025 के लिए

USD/CAD के दैनिक चार्ट पर, मार्लिन ऑस्सीलेटर यह संकेत देता है कि मूल्य एक संभावित ऊर्ध्वगामी पलटाव के लिए तैयार है। नीचे 1.3746 का लक्ष्य स्तर और मूल्य चैनल की

Laurie Bailey 11:41 2025-04-17 UTC+2

GBP/USD पूर्वानुमान – 17 अप्रैल, 2025 के लिए।

कल, ब्रिटेन ने मार्च महीने के लिए मुद्रास्फीति के आंकड़े जारी किए। कोर सीपीआई साल-दर-साल 3.0% से घटकर 2.8% हो गई, और हेडलाइन सीपीआई 2.8% से गिरकर 2.6%

Laurie Bailey 11:37 2025-04-17 UTC+2

EUR/USD पूर्वानुमान – 17 अप्रैल, 2025 के लिए

बुधवार को यूरो एक बार फिर 1.1385–1.1420 के लक्षित दायरे में आ गया। हालांकि, हालिया मूल्य गतिविधि से संकेत मिलता है कि अब 1.1385 का स्तर अप्रासंगिक हो गया है

Laurie Bailey 11:33 2025-04-17 UTC+2

नैस्डैक 100 इंडेक्स की इंट्राडे मूल्य चाल का तकनीकी विश्लेषण, गुरुवार, 17 अप्रैल, 2025।

जैसा कि हम नैस्डैक 100 इंडेक्स के 4-घंटे के चार्ट पर देख सकते हैं, वहां कई दिलचस्प बातें हैं, अर्थात, पहले, मूल्य चाल MA (100) के नीचे जा रही है

Arief Makmur 08:31 2025-04-17 UTC+2

ऑस्ट्रेलियाई डॉलर/जापानी येन (AUD/JPY) क्रॉस करेंसी पेयर की इंट्राडे मूल्य आंदोलन की तकनीकी विश्लेषण, बुधवार 16 अप्रैल, 2025।

स्टोकास्टिक ऑस्सीलेटर की स्थिति चार घंटे के चार्ट पर ओवरसोल्ड स्तर (20) की ओर बढ़ने के साथ, निकट भविष्य में AUD/JPY में 89.75-89.39 क्षेत्र स्तर तक कमजोरी आने की संभावना

Arief Makmur 11:29 2025-04-16 UTC+2
अभी बात नहीं कर सकते?
अपना प्रश्न पूछें बातचीत.
Widget callback
 

Dear visitor,

Your IP address shows that you are currently located in the USA. If you are a resident of the United States, you are prohibited from using the services of InstaFintech Group including online trading, online transfers, deposit/withdrawal of funds, etc.

If you think you are seeing this message by mistake and your location is not the US, kindly proceed to the website. Otherwise, you must leave the website in order to comply with government restrictions.

Why does your IP address show your location as the USA?

  • - you are using a VPN provided by a hosting company based in the United States;
  • - your IP does not have proper WHOIS records;
  • - an error occurred in the WHOIS geolocation database.

Please confirm whether you are a US resident or not by clicking the relevant button below. If you choose the wrong option, being a US resident, you will not be able to open an account with InstaForex anyway.

We are sorry for any inconvenience caused by this message.