Actual patterns
Patterns are graphical models which are formed in the chart by the price. According to one of the technical analysis postulates, history (price movement) repeats itself. It means that the price movements are often similar in the same situations which makes it possible to predict the further development of the situation with a high probability.
Actual Patterns
- All
- Double Top
- Flag
- Head and Shoulders
- Pennant
- Rectangle
- Triangle
- Triple top
- All
- #AAPL
- #AMZN
- #Bitcoin
- #EBAY
- #FB
- #GOOG
- #INTC
- #KO
- #MA
- #MCD
- #MSFT
- #NTDOY
- #PEP
- #TSLA
- #TWTR
- AUDCAD
- AUDCHF
- AUDJPY
- AUDUSD
- EURCAD
- EURCHF
- EURGBP
- EURJPY
- EURNZD
- EURRUB
- EURUSD
- GBPAUD
- GBPCHF
- GBPJPY
- GBPUSD
- GOLD
- NZDCAD
- NZDCHF
- NZDJPY
- NZDUSD
- SILVER
- USDCAD
- USDCHF
- USDJPY
- USDRUB
- All
- M5
- M15
- M30
- H1
- D1
- All
- Buy
- Sale
- All
- 1
- 2
- 3
- 4
- 5
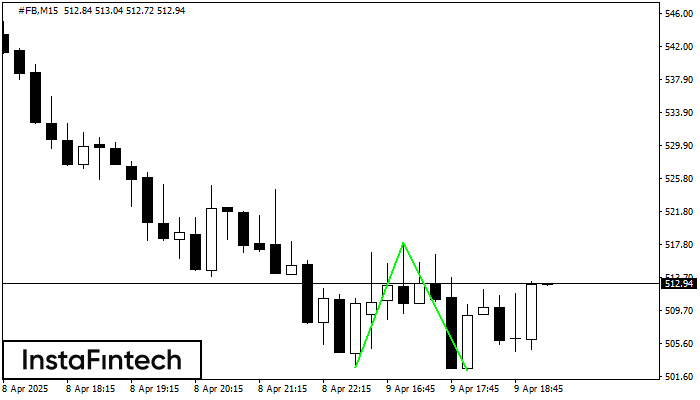
The Double Bottom pattern has been formed on #FB M15. This formation signals a reversal of the trend from downwards to upwards. The signal is that a buy trade should
The M5 and M15 time frames may have more false entry points.
Open chart in a new window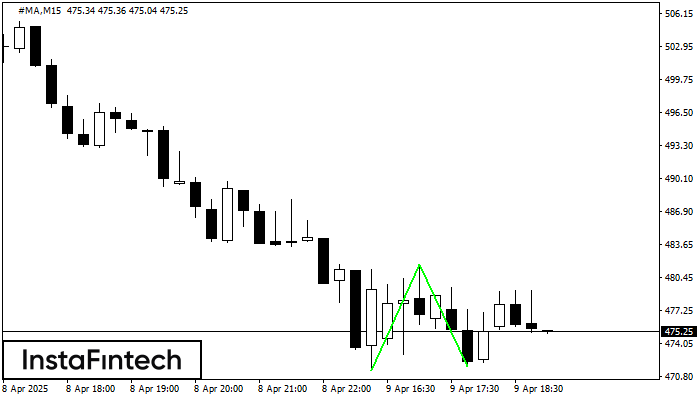
The Double Bottom pattern has been formed on #MA M15; the upper boundary is 481.71; the lower boundary is 471.86. The width of the pattern is 1024 points. In case
The M5 and M15 time frames may have more false entry points.
Open chart in a new window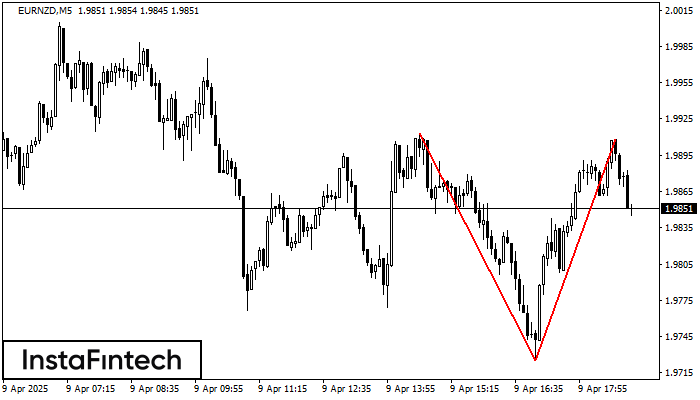
On the chart of EURNZD M5 the Double Top reversal pattern has been formed. Characteristics: the upper boundary 1.9908; the lower boundary 1.9725; the width of the pattern 183 points
The M5 and M15 time frames may have more false entry points.
Open chart in a new window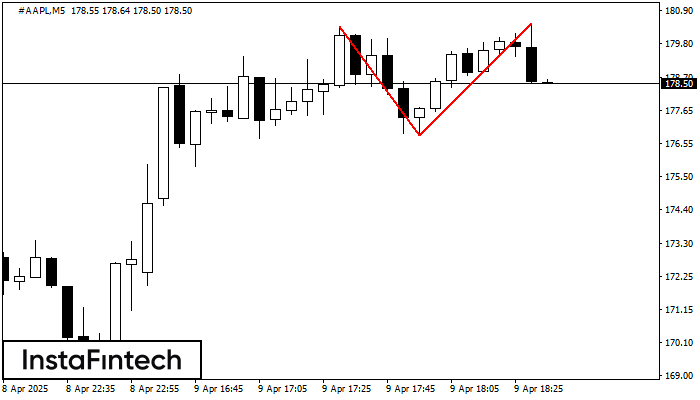
The Double Top pattern has been formed on #AAPL M5. It signals that the trend has been changed from upwards to downwards. Probably, if the base of the pattern 176.83
The M5 and M15 time frames may have more false entry points.
Open chart in a new window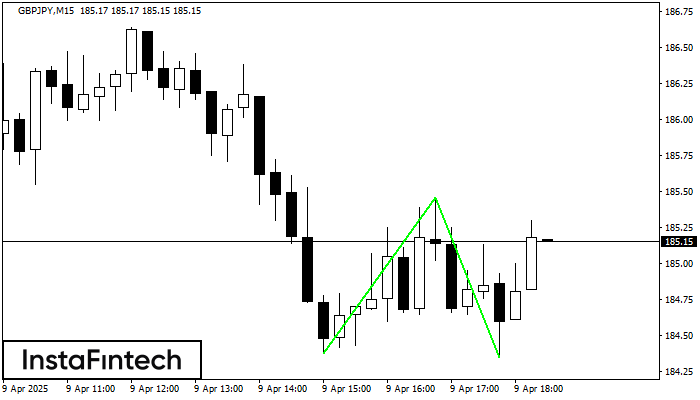
The Double Bottom pattern has been formed on GBPJPY M15; the upper boundary is 185.46; the lower boundary is 184.35. The width of the pattern is 108 points. In case
The M5 and M15 time frames may have more false entry points.
Open chart in a new window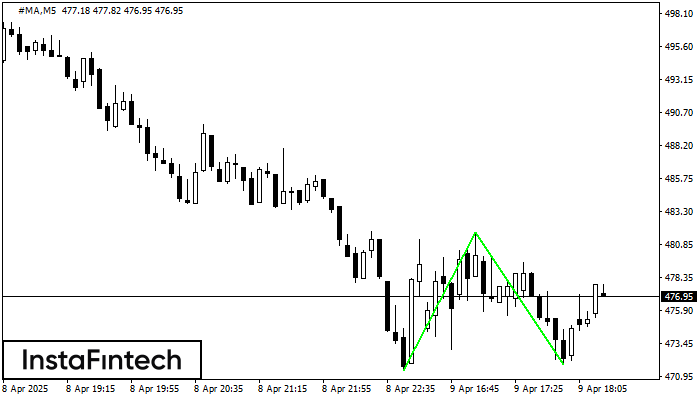
The Double Bottom pattern has been formed on #MA M5. Characteristics: the support level 471.47; the resistance level 481.71; the width of the pattern 1024 points. If the resistance level
The M5 and M15 time frames may have more false entry points.
Open chart in a new window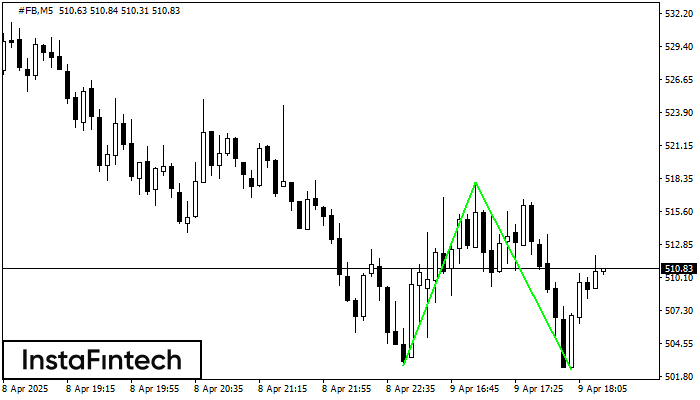
The Double Bottom pattern has been formed on #FB M5; the upper boundary is 518.05; the lower boundary is 502.39. The width of the pattern is 1532 points. In case
The M5 and M15 time frames may have more false entry points.
Open chart in a new window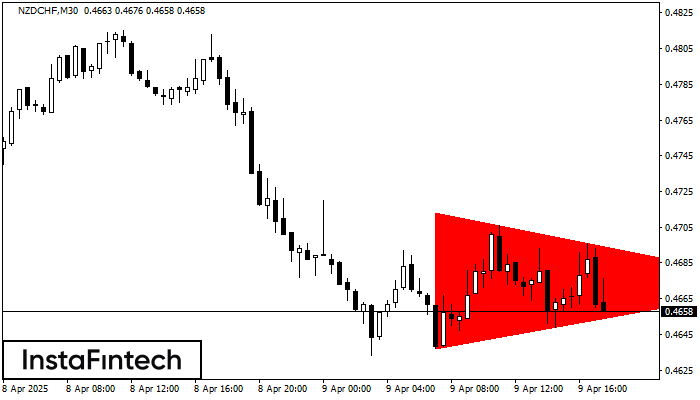
According to the chart of M30, NZDCHF formed the Bearish Symmetrical Triangle pattern. Description: The lower border is 0.4637/0.4673 and upper border is 0.4713/0.4673. The pattern width is measured
Open chart in a new window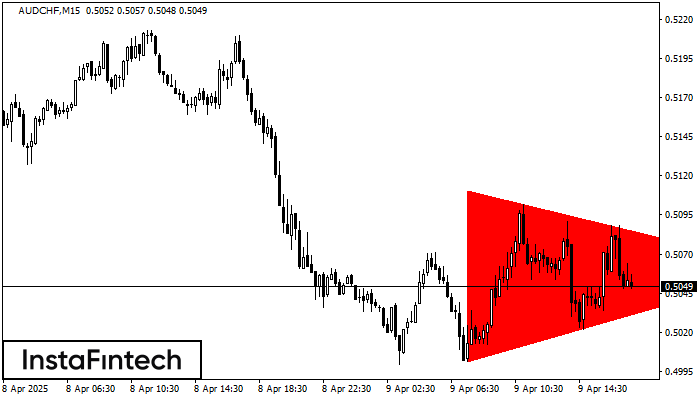
According to the chart of M15, AUDCHF formed the Bearish Symmetrical Triangle pattern. This pattern signals a further downward trend in case the lower border 0.5001 is breached. Here
The M5 and M15 time frames may have more false entry points.
Open chart in a new window