


сила сигнала 1 из 5
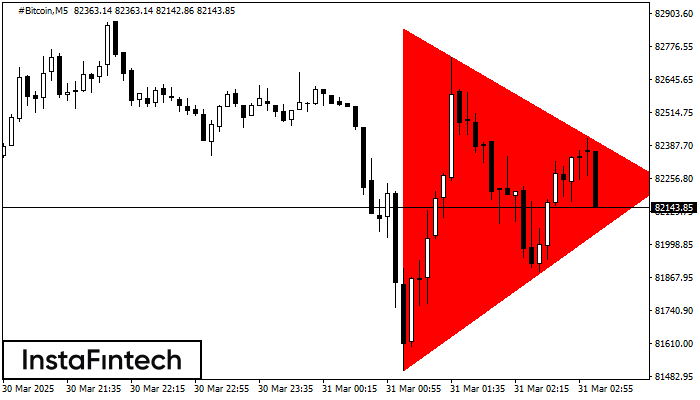
На графике #Bitcoin M5 сформировалась фигура «Медвежий симметричный треугольник». Характеристика фигуры: Нижняя граница 81505.64/82241.48; Верхняя граница 82843.91/82241.48; Проекция ширины фигуры -133827 пунктов. Формирование фигуры «Медвежий симметричный треугольник» наиболее вероятным образом свидетельствует о продолжении нисходящего тренда. Это означает, что курс #Bitcoin, в случае срабатывания фигуры, пробьет нижнюю границу и, вероятно, проследует к 82241.33.
Таймфреймы М5 и М15 могут иметь больше ложных точек входа.
Смотрите также
- Все
- Вымпел
- Голова и плечи
- Двойная вершина
- Прямоугольник
- Треугольник
- Тройная вершина
- Флаг
- Все
- #AAPL
- #AMZN
- #Bitcoin
- #EBAY
- #FB
- #GOOG
- #INTC
- #KO
- #MA
- #MCD
- #MSFT
- #NTDOY
- #PEP
- #TSLA
- #TWTR
- AUDCAD
- AUDCHF
- AUDJPY
- AUDUSD
- EURCAD
- EURCHF
- EURGBP
- EURJPY
- EURNZD
- EURRUB
- EURUSD
- GBPAUD
- GBPCHF
- GBPJPY
- GBPUSD
- GOLD
- NZDCAD
- NZDCHF
- NZDJPY
- NZDUSD
- SILVER
- USDCAD
- USDCHF
- USDJPY
- USDRUB
- Все
- M5
- M15
- M30
- H1
- D1
- Все
- Покупка
- Продажа
- Все
- 1
- 2
- 3
- 4
- 5
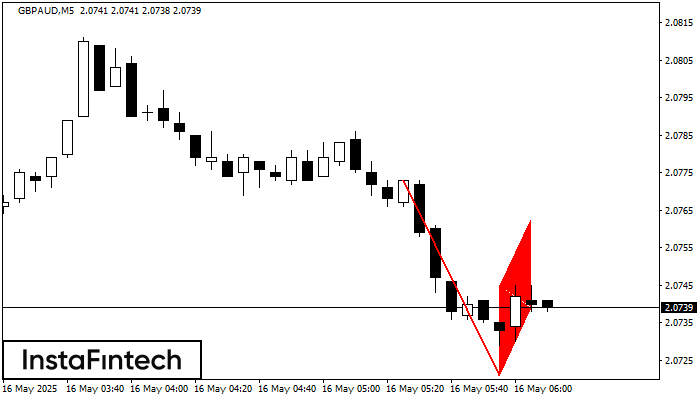
The Bearish Flag pattern has been formed on the chart GBPAUD M5 which signals that the downward trend will continue. If the price breaks below the low at 2.0721, then
The M5 and M15 time frames may have more false entry points.
Open chart in a new window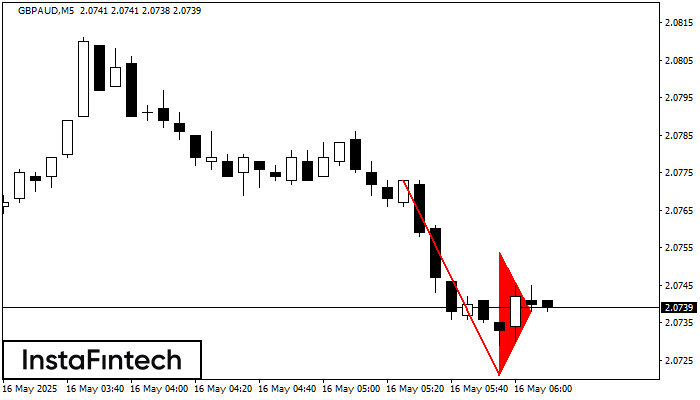
The Bearish pennant pattern has formed on the GBPAUD M5 chart. It signals potential continuation of the existing trend. Specifications: the pattern’s bottom has the coordinate of 2.0721; the projection
The M5 and M15 time frames may have more false entry points.
Open chart in a new window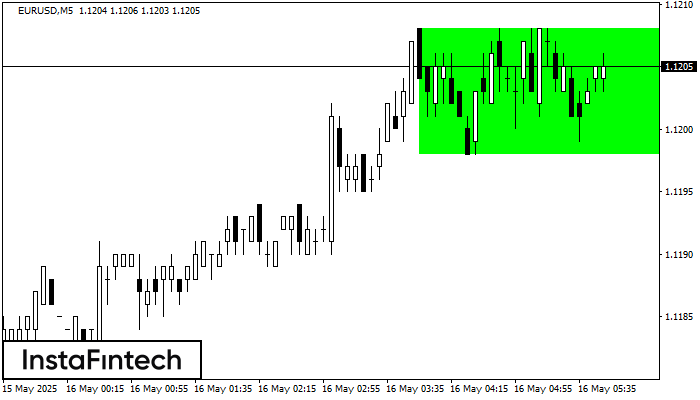
According to the chart of M5, EURUSD formed the Bullish Rectangle which is a pattern of a trend continuation. The pattern is contained within the following borders: the lower border
The M5 and M15 time frames may have more false entry points.
Open chart in a new window


