empty
сформирован 02.04 в 01:43:27 (UTC+0)
сила сигнала 1 из 5
Бычий вымпел NZDCHF M5

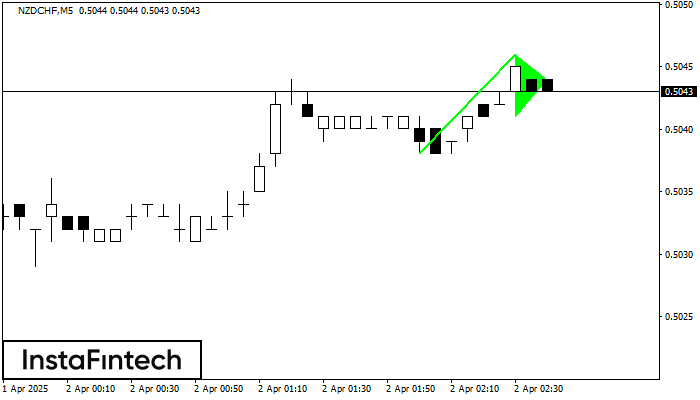
Графическая фигура «Бычий вымпел» сформировалась по инструменту NZDCHF на M5. Данный вид фигуры относится к типу продолжения тенденции. В случае если котировке удастся преодолеть максимум вымпела 0.5046, то ожидается продолжение восходящего тренда к уровню 0.5061.

Таймфреймы М5 и М15 могут иметь больше ложных точек входа.

Фигура
  • Все
  • Вымпел
  • Голова и плечи
  • Двойная вершина
  • Прямоугольник
  • Треугольник
  • Тройная вершина
  • Флаг
Инструмент
  • Все
  • #AAPL
  • #AMZN
  • #Bitcoin
  • #EBAY
  • #FB
  • #GOOG
  • #INTC
  • #KO
  • #MA
  • #MCD
  • #MSFT
  • #NTDOY
  • #PEP
  • #TSLA
  • #TWTR
  • AUDCAD
  • AUDCHF
  • AUDJPY
  • AUDUSD
  • EURCAD
  • EURCHF
  • EURGBP
  • EURJPY
  • EURNZD
  • EURRUB
  • EURUSD
  • GBPAUD
  • GBPCHF
  • GBPJPY
  • GBPUSD
  • GOLD
  • NZDCAD
  • NZDCHF
  • NZDJPY
  • NZDUSD
  • SILVER
  • USDCAD
  • USDCHF
  • USDJPY
  • USDRUB
Таймфрейм
  • Все
  • M5
  • M15
  • M30
  • H1
  • D1
Тренд
  • Все
  • Покупка
  • Продажа
Сила сигнала
  • Все
  • 1
  • 2
  • 3
  • 4
  • 5
Bearish Symmetrical Triangle
was formed on 07.05 at 11:37:52 (UTC+0)
signal strength 2 of 5
Bearish Symmetrical Triangle USDCHF M15

According to the chart of M15, USDCHF formed the Bearish Symmetrical Triangle pattern. This pattern signals a further downward trend in case the lower border 0.8211 is breached. Here

The M5 and M15 time frames may have more false entry points.

Open chart in a new window
Bearish Symmetrical Triangle
was formed on 07.05 at 11:37:50 (UTC+0)
signal strength 3 of 5
Bearish Symmetrical Triangle USDCHF M30

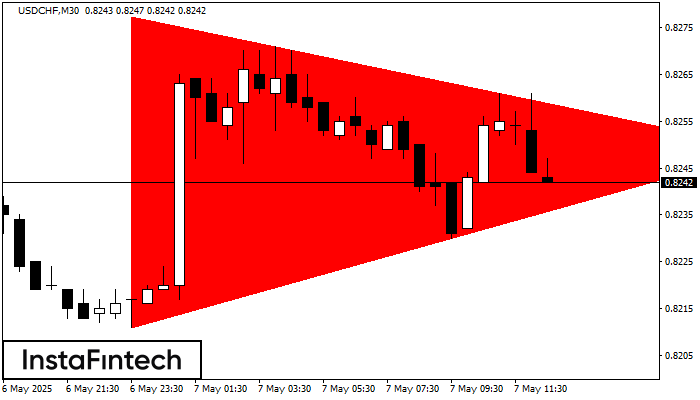
According to the chart of M30, USDCHF formed the Bearish Symmetrical Triangle pattern. This pattern signals a further downward trend in case the lower border 0.8211 is breached. Here

Open chart in a new window
Bullish Symmetrical Triangle
was formed on 07.05 at 11:25:56 (UTC+0)
signal strength 1 of 5
Bullish Symmetrical Triangle EURCAD M5

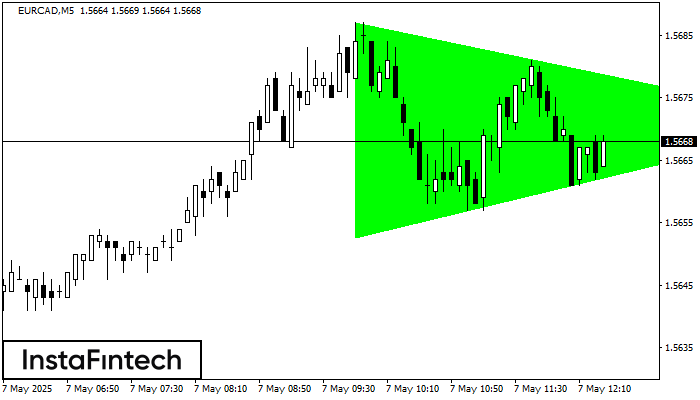
According to the chart of M5, EURCAD formed the Bullish Symmetrical Triangle pattern. The lower border of the pattern touches the coordinates 1.5653/1.5671 whereas the upper border goes across 1.5687/1.5671

The M5 and M15 time frames may have more false entry points.

Open chart in a new window
Сейчас не можете говорить по телефону?
Задайте Ваш вопрос в чате.
Обратный звонок
 

Dear visitor,

Your IP address shows that you are currently located in the USA. If you are a resident of the United States, you are prohibited from using the services of InstaFintech Group including online trading, online transfers, deposit/withdrawal of funds, etc.

If you think you are seeing this message by mistake and your location is not the US, kindly proceed to the website. Otherwise, you must leave the website in order to comply with government restrictions.

Why does your IP address show your location as the USA?

  • - you are using a VPN provided by a hosting company based in the United States;
  • - your IP does not have proper WHOIS records;
  • - an error occurred in the WHOIS geolocation database.

Please confirm whether you are a US resident or not by clicking the relevant button below. If you choose the wrong option, being a US resident, you will not be able to open an account with InstaForex anyway.

We are sorry for any inconvenience caused by this message.