signal strength 3 of 5
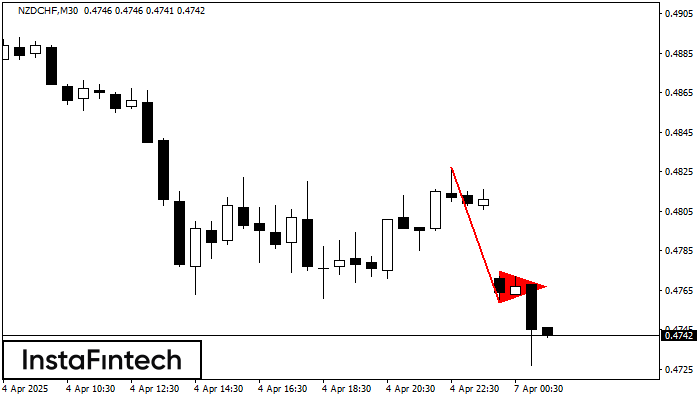
The Bearish pennant pattern has formed on the NZDCHF M30 chart. It signals potential continuation of the existing trend. Specifications: the pattern’s bottom has the coordinate of 0.4759; the projection of the flagpole height is equal to 68 pips. In case the price breaks out the pattern’s bottom of 0.4759, the downtrend is expected to continue for further level 0.4729.
Juga lihat
- All
- Double Top
- Flag
- Head and Shoulders
- Pennant
- Rectangle
- Triangle
- Triple top
- All
- #AAPL
- #AMZN
- #Bitcoin
- #EBAY
- #FB
- #GOOG
- #INTC
- #KO
- #MA
- #MCD
- #MSFT
- #NTDOY
- #PEP
- #TSLA
- #TWTR
- AUDCAD
- AUDCHF
- AUDJPY
- AUDUSD
- EURCAD
- EURCHF
- EURGBP
- EURJPY
- EURNZD
- EURRUB
- EURUSD
- GBPAUD
- GBPCHF
- GBPJPY
- GBPUSD
- GOLD
- NZDCAD
- NZDCHF
- NZDJPY
- NZDUSD
- SILVER
- USDCAD
- USDCHF
- USDJPY
- USDRUB
- All
- M5
- M15
- M30
- H1
- D1
- All
- Buy
- Sale
- All
- 1
- 2
- 3
- 4
- 5
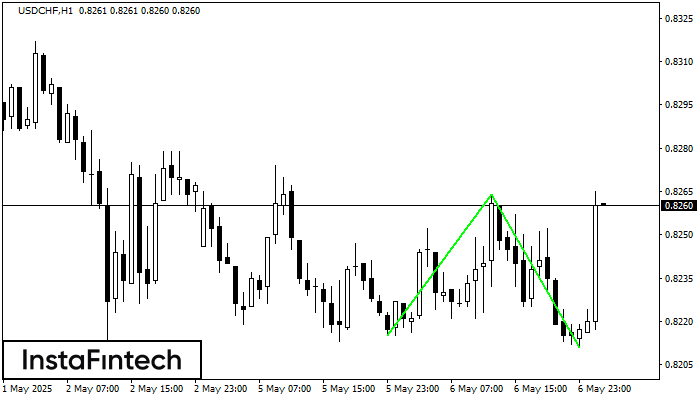
Corak Double Bottom telah dibentuk pada USDCHF H1; sempadan atas adalah 0.8264; sempadan bawah adalah 0.8211. Lebar corak adalah 49 mata. Sekiranya penembusan sempadan atas 0.8264, perubahan aliran boleh diramalkan
Open chart in a new window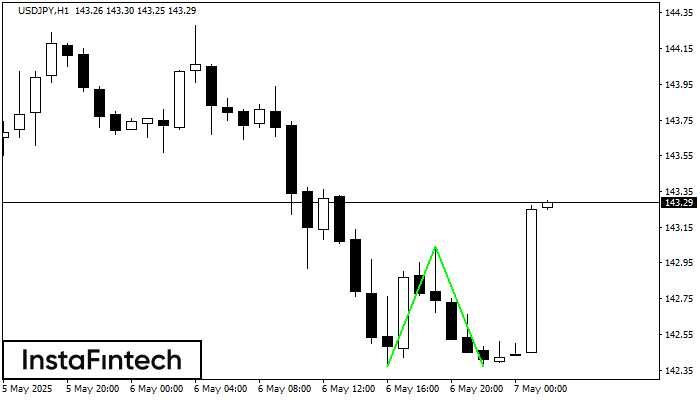
Corak Double Bottom telah dibentuk pada USDJPY H1. Ciri-ciri: tahap sokongan 142.37; tahap rintangan 143.04; lebar corak 67 mata. Sekiranya tahap rintangan ditembusi, perubahan aliran boleh diramalkan dengan titik sasaran
Open chart in a new window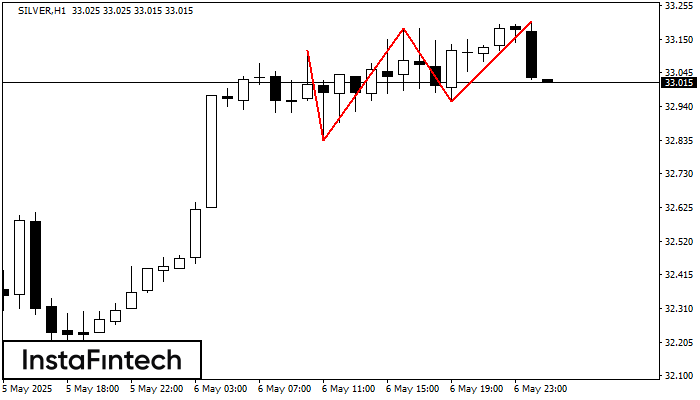
Corak Triple Top telah dibentuk pada carta SILVER H1. Ciri corak: sempadan mempunyai sudut menaik; garisan bawah corak mempunyai koordinat 32.84/32.95 dengan had atas 33.12/33.20; unjuran lebar ialah 280 mata
Open chart in a new window