signal strength 4 of 5
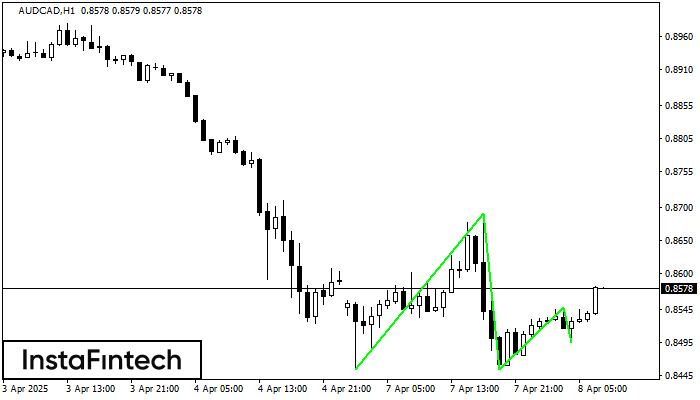
The Triple Bottom pattern has been formed on AUDCAD H1. It has the following characteristics: resistance level 0.8692/0.8549; support level 0.8454/0.8496; the width is 238 points. In the event of a breakdown of the resistance level of 0.8692, the price is likely to continue an upward movement at least to 0.8495.
See Also
- All
- Double Top
- Flag
- Head and Shoulders
- Pennant
- Rectangle
- Triangle
- Triple top
- All
- #AAPL
- #AMZN
- #Bitcoin
- #EBAY
- #FB
- #GOOG
- #INTC
- #KO
- #MA
- #MCD
- #MSFT
- #NTDOY
- #PEP
- #TSLA
- #TWTR
- AUDCAD
- AUDCHF
- AUDJPY
- AUDUSD
- EURCAD
- EURCHF
- EURGBP
- EURJPY
- EURNZD
- EURRUB
- EURUSD
- GBPAUD
- GBPCHF
- GBPJPY
- GBPUSD
- GOLD
- NZDCAD
- NZDCHF
- NZDJPY
- NZDUSD
- SILVER
- USDCAD
- USDCHF
- USDJPY
- USDRUB
- All
- M5
- M15
- M30
- H1
- D1
- All
- Buy
- Sale
- All
- 1
- 2
- 3
- 4
- 5

The Triple Top pattern has formed on the chart of the #Bitcoin M15. Features of the pattern: borders have an ascending angle; the lower line of the pattern
The M5 and M15 time frames may have more false entry points.
Open chart in a new window
The Triple Top pattern has formed on the chart of the #Bitcoin M30 trading instrument. It is a reversal pattern featuring the following characteristics: resistance level -11522, support level -38318
Open chart in a new window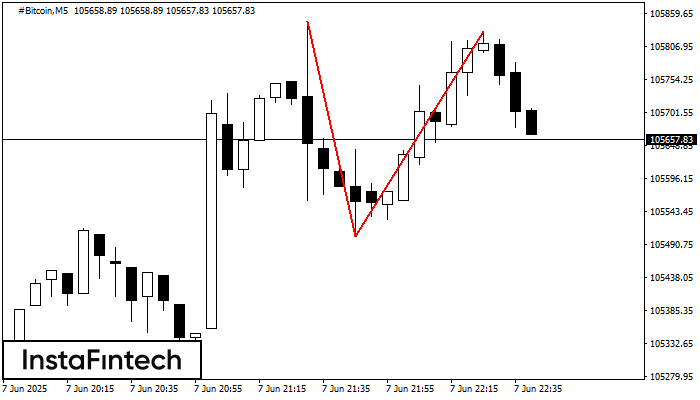
On the chart of #Bitcoin M5 the Double Top reversal pattern has been formed. Characteristics: the upper boundary 105831.35; the lower boundary 105502.73; the width of the pattern 32862 points
The M5 and M15 time frames may have more false entry points.
Open chart in a new window