

signal strength 2 of 5
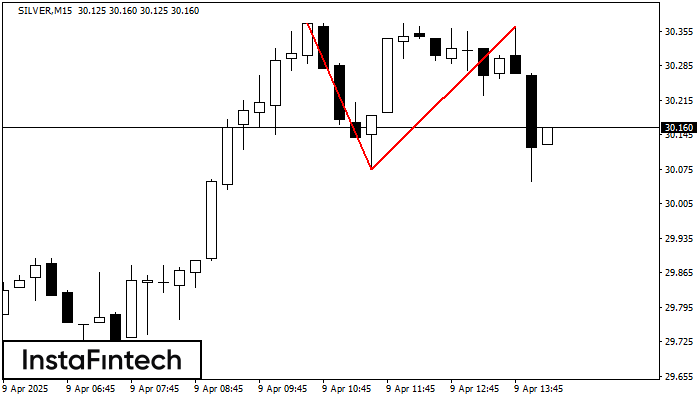
The Double Top pattern has been formed on SILVER M15. It signals that the trend has been changed from upwards to downwards. Probably, if the base of the pattern 30.07 is broken, the downward movement will continue.
The M5 and M15 time frames may have more false entry points.
See Also
- All
- Double Top
- Flag
- Head and Shoulders
- Pennant
- Rectangle
- Triangle
- Triple top
- All
- #AAPL
- #AMZN
- #Bitcoin
- #EBAY
- #FB
- #GOOG
- #INTC
- #KO
- #MA
- #MCD
- #MSFT
- #NTDOY
- #PEP
- #TSLA
- #TWTR
- AUDCAD
- AUDCHF
- AUDJPY
- AUDUSD
- EURCAD
- EURCHF
- EURGBP
- EURJPY
- EURNZD
- EURRUB
- EURUSD
- GBPAUD
- GBPCHF
- GBPJPY
- GBPUSD
- GOLD
- NZDCAD
- NZDCHF
- NZDJPY
- NZDUSD
- SILVER
- USDCAD
- USDCHF
- USDJPY
- USDRUB
- All
- M5
- M15
- M30
- H1
- D1
- All
- Buy
- Sale
- All
- 1
- 2
- 3
- 4
- 5
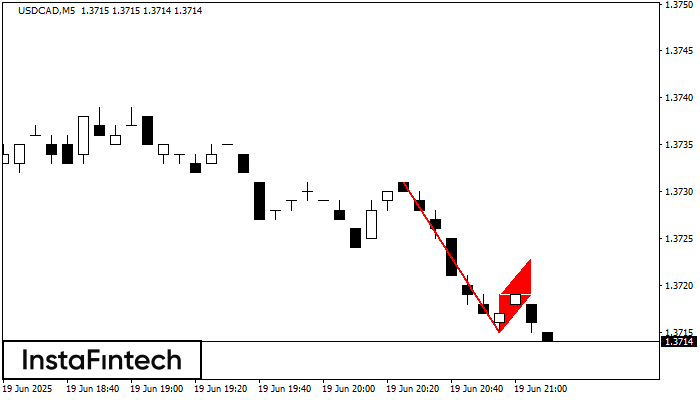
Mô hình Cờ giảm đã được hình thành trên USDCAD at M5. Đường viền dưới của mô hình nằm ở 1.3715/1.3719 trong khi đường viền trên nằm ở 1.3719/1.3723. Hình
Khung thời gian M5 và M15 có thể có nhiều điểm vào lệnh sai hơn.
Open chart in a new window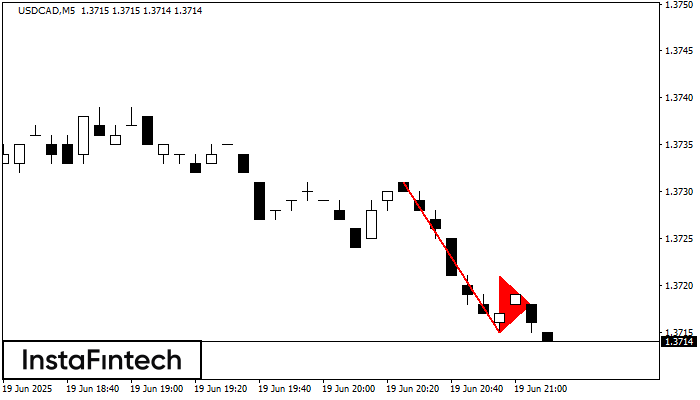
Mô hình Cờ hiệu giảm đã được hình thành trên biểu đồ USDCAD M5. Nó báo hiệu tiềm năng tiếp tục của xu hướng hiện tại. Thông số kỹ thuật
Khung thời gian M5 và M15 có thể có nhiều điểm vào lệnh sai hơn.
Open chart in a new window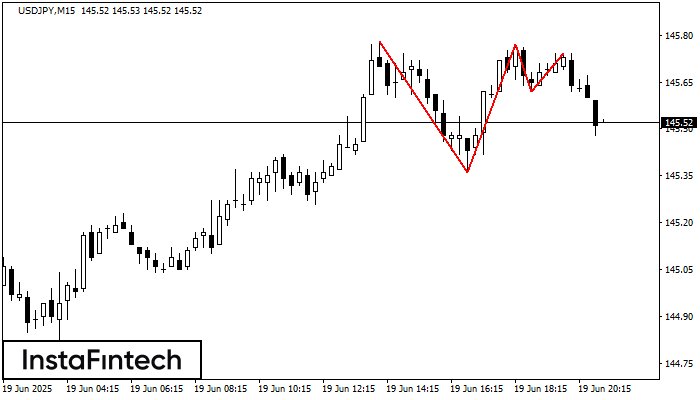
Trên biểu đồ của công cụ giao dịch USDJPY M15, mô hình Đỉnh ba báo hiệu sự thay đổi xu hướng đã hình thành. Có thể sau khi hình thành
Khung thời gian M5 và M15 có thể có nhiều điểm vào lệnh sai hơn.
Open chart in a new window


