empty
19.03.2025 06:36 AM
EUR/USD and GBP/USD March 19 – Technical Analysis

EUR/USD

This image is no longer relevant

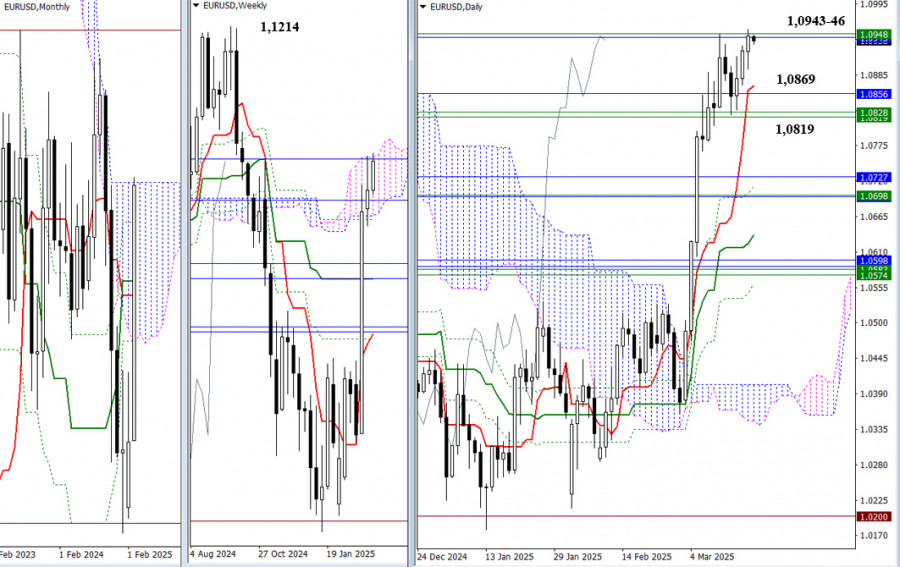
The pair is currently testing the upper boundaries of the monthly Ichimoku cloud at 1.0943 and the weekly cloud at 1.0946. If buyers can consolidate in the bullish zone relative to these clouds, they will open up new opportunities and set upward targets to break through the cloud. The next bullish targets are the nearest extreme highs at 1.1214 and 1.1276. However, if the current resistance levels (1.0943-1.0946) are able to push the market back again, as it did last week, we could see a pullback and a daily downward correction that brings the price back toward the support cluster around 1.0819 to 1.0856, as well as the daily short-term trend at 1.0869. Consolidation below these levels would shift sentiment on the weekly timeframe, causing the pair to return to the bearish zone relative to the weekly cloud.

This image is no longer relevant

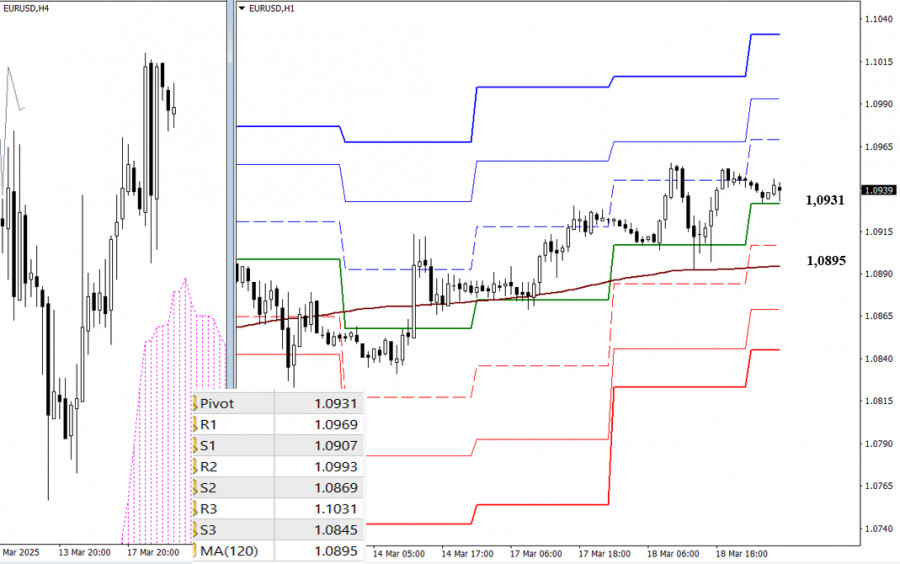
On lower timeframes, bulls currently have the advantage. Key levels for further upward movement today are 1.0969, 1.0993, and 1.1031, which are resistance levels based on classic Pivot points. If the current support at the central Pivot level (1.0931) is broken and a downward corrective move develops, the most significant test will be the long-term weekly trend at 1.0895. A breakout and reversal of this trend could shift the balance of power toward a stronger bearish sentiment. Additional intraday bearish targets include the classic Pivot support levels at 1.0907, 1.0869, and 1.0845.

***

GBP/USD

This image is no longer relevant

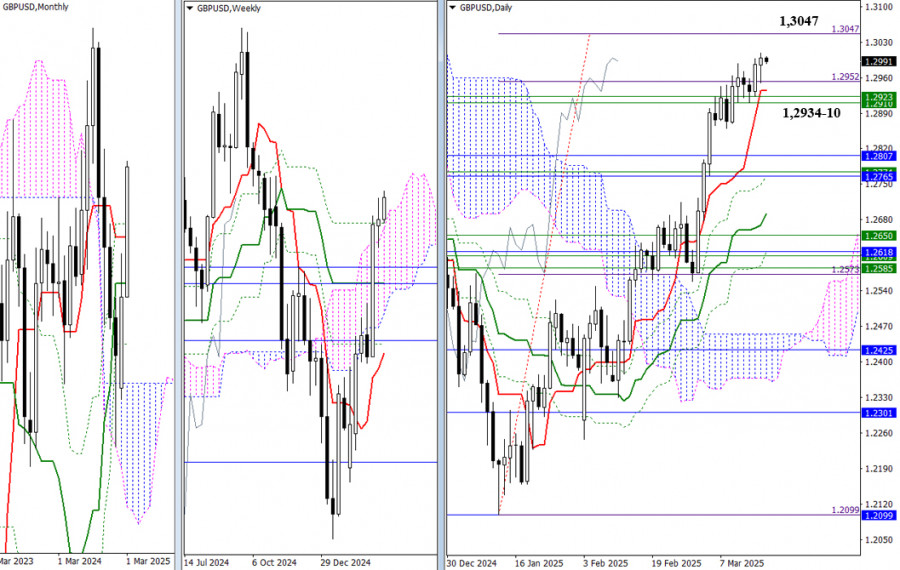
The currency pair has recently updated last week's high of 1.2988 and continues to rise gradually. The next target is the 100% completion level at 1.3047. If it successfully reaches the daily breakout target of the cloud and consolidates above this level, buyers will have the opportunity to explore new bullish prospects. However, if there is another failure, the market could retrace toward the support cluster at 1.2934, 1.2923, and 1.2910, which align with daily short-term trends and weekly levels. A firm consolidation below these levels could foster a bearish sentiment.

This image is no longer relevant

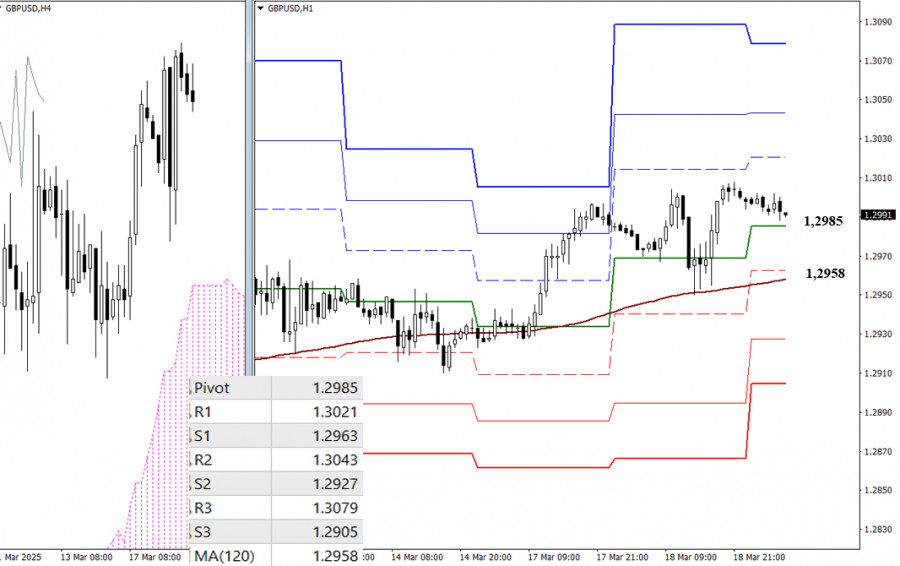
On lower timeframes, bulls currently maintain the upper hand. If the upward movement persists, key levels to monitor for breakouts include the classic Pivot resistance levels at 1.3021, 1.3043, and 1.3079. Conversely, if a correction gains momentum, the most critical level to test and break would be the long-term weekly trend at 1.2958. A shift in focus toward the downside could reinforce the bearish sentiment and create new opportunities for sellers, with additional support levels at 1.2927 and 1.2905, based on Pivot levels.

***

Technical Analysis Components:
  • Higher Timeframes: Ichimoku Kinko Hyo (9.26.52) and Fibonacci Kijun levels
  • H1: Classic Pivot Points and 120-period Moving Average (weekly long-term trend)
Evangelos Poulakis,
انسٹافاریکس کا تجزیاتی ماہر
© 2007-2025
ٹائم فریم منتخب کریں
5
منٹ
15
منٹ
30
منٹ
1
گھنٹہ
4
گھنٹے
1
دن
1
ہفتہ
انسٹافاریکس کے ساتھ کرپٹو کرنسی کی معاملاتی تبدیلیوں سے کمائیں۔
میٹا ٹریڈر 4 ڈاؤن لوڈ کریں اور اپنی پہلی ٹریڈ کھولیں۔
  • Grand Choice
    Contest by
    InstaForex
    InstaForex always strives to help you
    fulfill your biggest dreams.
    مقابلہ میں شامل ہوں

تجویز کردہ مضامین

اپریل 3-5 2025 کے لیے سونے (ایکس اے یو / یو ایس ڈی) کے لیے تجارتی سگنل: $3,055 سے اوپر خریدیں (21 ایس ایم اے ایس ایم اے- واپسی)

اگر سونے کی قیمت اپ ٹرینڈ چینل کے اوپر واپس آتی ہے اور 3,075 سے اوپر مستحکم ہوتی ہے، تو آؤٹ لک تیزی کا شکار ہو سکتا ہے،

Dimitrios Zappas 18:20 2025-04-03 UTC+2

جی بی پی / یو ایس ڈی - 3 اپریل: ڈالر کے لیے ہفتہ کا بے معنی اختتام

گھنٹہ وار چارٹ پر، جی بی پی / یو ایس ڈی جوڑا ایک بار پھر اوپر کی طرف بڑھ گیا، کئی سطحوں اور مزاحمتی زونوں کو توڑ کر۔ اس وقت،

Samir Klishi 17:20 2025-04-03 UTC+2

جی بی ہی / یو ایس ڈی پیشن گوئی برائے 02 اپریل 2025

فی گھنٹہ چارٹ پر، جی بی پی / یو ایس ڈی پئیر منگل کو ایک طرف حرکت کرتا رہا۔ مارکیٹ میں فی الحال بُلز یا بئیرز کا کوئی غلبہ نہیں

Samir Klishi 16:55 2025-04-02 UTC+2

اپریل 2-5 2025 کے لیے یورو / یو ایس ڈی کے لیے تجارتی سگنل: 1.0815 سے نیچے فروخت کریں (21 ایس ایم اے - +1/8 مرے)

اگر یورو بیئرش ٹرینڈ چینل کے اوپر بریک کرتا ہے ہے اور مضبوط ہوتا ہے، تو ہم آنے والے دنوں میں اس کے +1/8 مرے کی سطح 1.0864 تک پہنچنے

Dimitrios Zappas 16:43 2025-04-02 UTC+2

یورو / یو ایس ڈی کی پیش گوئی برائے 02 اپریل 2025

منگل کو، یورو / یو ایس ڈی جوڑا سپورٹ زون سے 1.0781–1.0797 پر واپس آیا لیکن 1.0857 پر 200.0% فیبوناچی سطح تک بڑھنے میں ناکام رہا۔ بدھ کی صبح، جوڑا

Samir Klishi 16:25 2025-04-02 UTC+2

اپریل 2-5 2025 کے لیے سونے (ایکس اے یو / یو ایس ڈی) کے لیے تجارتی اشارہ: $3,140 سے نیچے فروخت کریں یا $3,110 سے اوپر خریدیں (21 ایس ایم اے - ہم آہنگ مثلث)

امریکی سیشن کے شروع میں، سونا 3,122 کے ارد گرد ٹریڈ کر رہا ہے، 21 ایس ایم اے سے اوپر، اور 3,149 پر اپنی ہمہ وقتی بلندی سے تشکیل پانے

Dimitrios Zappas 16:20 2025-04-02 UTC+2

جی بی پی / یو ایس ڈی اپریل 1. سائیڈ ویز موومنٹ کا ایک مہینہ اور نئے ٹیرف کا خطرہ

فی گھنٹہ کے چارٹ پر، جی بی پی / یو ایس ڈی پئیر نے پیر کو بھی ساتھ ساتھ تجارت جاری رکھی۔ فی الحال بازار میں بُلز یا بئیرز

Samir Klishi 16:53 2025-04-01 UTC+2

یورو / یو ایس ڈی 1 اپریل۔ تاجر الجھن میں ہیں اور خطرہ مول لینے کو تیار نہیں ہیں۔

پیر کو، یورو / یو ایس ڈی پئیر نے اپنی اوپر کی حرکت کو جاری رکھا اور یہاں تک کہ سپورٹ زون سے 1.0781–1.0797 پر ریباؤنڈ ہوا۔ تاہم یورو

Samir Klishi 16:41 2025-04-01 UTC+2

اپریل 1-3 2025 کے لیے سونے (ایکس اے یو / یو ایس ڈی) کے لیے تجارتی سگنل: $3,144 سے نیچے فروخت (21 ایس ایم اے - 8/8 مرے)

دوسری طرف، اگر قیمت 8/8 مرے کی سطح سے نیچے 3,125 پر مستحکم ہو جاتی ہے، تو آؤٹ لک منفی ہو گا۔ لہذا، ہمیں یقین ہے کہ آلہ مختصر

Dimitrios Zappas 16:16 2025-04-01 UTC+2

اپریل 1-3 2025 کے لیے یورو / یو ایس ڈی کے لیے تجارتی سگنل: 1.0804 سے نیچے فروخت کریں (21 ایس ایم اے - 8/8 مرے)

ہم توقع کرتے ہیں کہ یورو آنے والے دنوں میں اپنی کمی کو جاری رکھے گا، جیسا کہ تکنیکی سطح بتاتی ہے کہ یہ 28 فروری کو 1.0365 کے قریب

Dimitrios Zappas 16:14 2025-04-01 UTC+2
ابھی فوری بات نہیں کرسکتے ؟
اپنا سوال پوچھیں بذریعہ چیٹ.
Widget callback
 

Dear visitor,

Your IP address shows that you are currently located in the USA. If you are a resident of the United States, you are prohibited from using the services of InstaFintech Group including online trading, online transfers, deposit/withdrawal of funds, etc.

If you think you are seeing this message by mistake and your location is not the US, kindly proceed to the website. Otherwise, you must leave the website in order to comply with government restrictions.

Why does your IP address show your location as the USA?

  • - you are using a VPN provided by a hosting company based in the United States;
  • - your IP does not have proper WHOIS records;
  • - an error occurred in the WHOIS geolocation database.

Please confirm whether you are a US resident or not by clicking the relevant button below. If you choose the wrong option, being a US resident, you will not be able to open an account with InstaForex anyway.

We are sorry for any inconvenience caused by this message.