empty
20.01.2025 01:12 AM
USD/JPY and EUR/JPY – Technical Analysis Overview

USD/JPY

This image is no longer relevant

Higher Timeframes

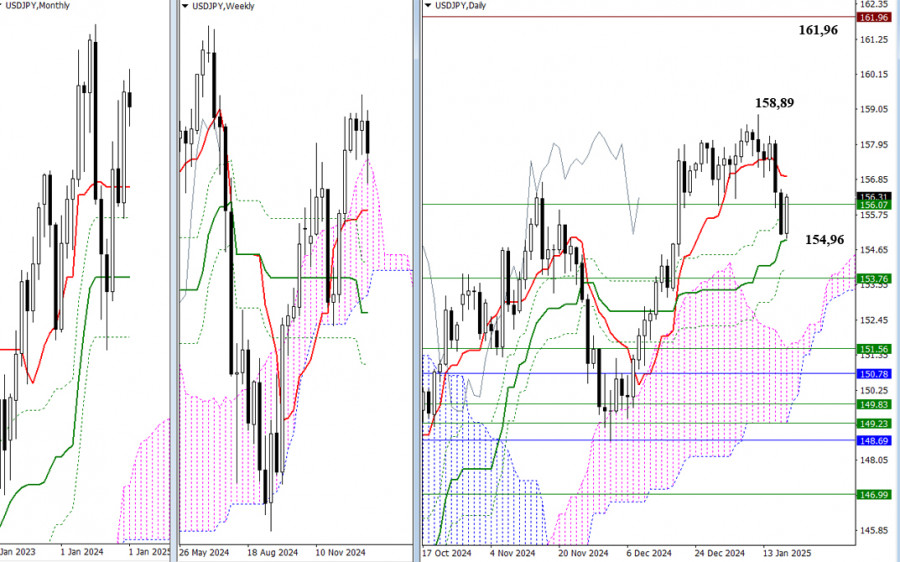
At the end of last week, we observed weekly consolidation, resulting in a long lower shadow reaching into the boundaries of the weekly Ichimoku cloud at 156.07. Sellers may now attempt to maintain the initiative needed to return to and consolidate within the weekly cloud. To do this successfully, they must first overcome the daily Ichimoku cross, which is situated between 154.96 and 154.03, and reclaim the weekly short-term trend at 153.76.

If sellers are unsuccessful and buyers manage to continue recovering their positions, the bulls will aim to regain the daily short-term trend at 156.94 and target a move out of the corrective zone at 158.89, which would allow them to resume the uptrend. Breaking the nearest high at 158.89 will restore the upward trend on both the daily and weekly timeframes. For the price to return to the monthly trend movement, it will need to surpass the monthly high at 161.96.

***

EUR/JPY

This image is no longer relevant

Higher Timeframes

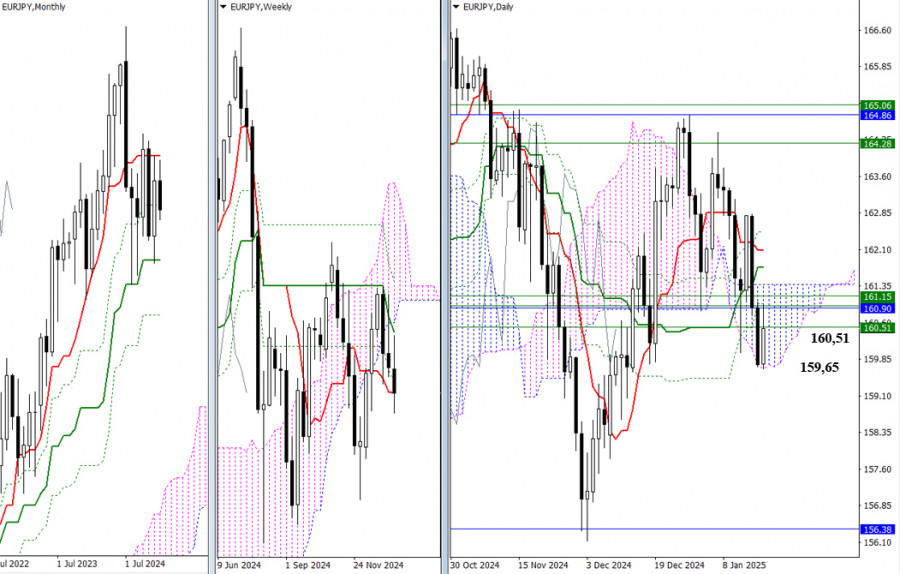
Last week, the EUR/JPY pair experienced a significant struggle. On Monday, buyers attempted to take control and initiate a corrective rally; however, their efforts were unsuccessful. Sellers managed to halt this rally, push the price to new lows, close below a critical support cluster, and reach the lower boundary of the daily Ichimoku cloud at 159.74.

On Friday, buyers launched another attempt, but the support cluster from Monday had transformed into resistance, which slowed the bullish recovery. This resistance zone, now reinforced by the daily Ichimoku cross, has expanded and lies between 160.51 and 162.46, with specific levels at 160.51, 160.90, 161.15, 161.38, 161.73, 162.08, and 162.46.

If buyers can break through this resistance zone, it could trigger a more sustained and significant bullish momentum. Conversely, if sellers maintain their position at these resistance levels, they will aim to push the price below the daily Ichimoku cloud at 159.65, targeting the monthly medium-term trend support at 156.38.

***

Technical Analysis Components:
  • Higher Timeframes: Ichimoku Kinko Hyo (9.26.52) and Fibonacci Kijun levels
  • H1: Classic Pivot Points and 120-period Moving Average (weekly long-term trend)
Evangelos Poulakis,
Especialista em análise na InstaForex
© 2007-2025
Selecionar intervalo de tempo
5
min
15
min
30
min
1
hora
4
horas
1
dia
1
s.
Ganhe com as variações das taxas das criptomoedas com a InstaForex.
Baixe o MetaTrader 4 e abra a sua primeira operação.
  • Grand Choice
    Contest by
    InstaForex
    InstaForex always strives to help you
    fulfill your biggest dreams.
    PARTICIPE DO CONCURSO

Recommended Stories

USD/JPY: Análise, previsão e situação atual do mercado

Osciladores negativos no gráfico de 4 horas indicam que qualquer novo movimento de alta pode ser interpretado como uma oportunidade de venda. Do ponto de vista técnico, a presença

Irina Yanina 21:43 2025-07-02 UTC+2

Sinais de negociação para o EUR/USD para 2-5 de julho de 2025: venda abaixo de 1,1840 (+1/8 de Murray - SMA 21)

Se o euro romper abaixo de 1,1762 e se consolidar abaixo dessa zona de preço, é possível uma aceleração de baixa. Portanto, o EUR/USD pode atingir a parte inferior

Dimitrios Zappas 19:30 2025-07-02 UTC+2

Sinais de negociação para o OURO (XAU/USD) para 2-8 de julho de 2025: comprar acima de 3.325 (SMA 21 - EMA 200)

O ouro pode estar se preparando para uma nova sequência de alta, de modo que o preço se consolide acima de 3.325 ou 3.312. Qualquer recuperação técnica será vista como

Dimitrios Zappas 19:26 2025-07-02 UTC+2

O AUD/USD poderá testar seu nível de resistência mais próximo na quarta-feira, 2 de julho de 2025.

AUD/USD – Quarta-feira, 2 de julho de 2025 O par de moedas AUD/USD foi impulsionado pela desvalorização do dólar americano devido à incerteza da guerra tarifária e à pressão para

Arief Makmur 16:15 2025-07-02 UTC+2

Previsão para o EUR/USD em 2 de julho de 2025

Na terça-feira, o par EUR/USD fez uma tentativa fracassada de se consolidar acima do nível 1,1802. Hoje, uma recuperação a partir desse nível favoreceria o dólar americano e uma queda

Samir Klishi 15:36 2025-07-02 UTC+2

Previsão para o GBP/USD em 2 de julho de 2025

No gráfico horário, o par GBP/USD continuou em alta na terça-feira, embora os compradores tenham recuado levemente, permitindo uma consolidação abaixo do nível corretivo de 200,0%, em 1,3749. Contudo, esse

Samir Klishi 14:54 2025-07-02 UTC+2

Embora o EUR/GBP tenha potencial para ser corrigido, há uma oportunidade para se fortalecer novamente, quarta-feira, 2 de julho de 2025.

EUR/GBP – Quarta-feira, 2 de julho de 2025 O EUR/GBP pode se fortalecer devido à política do BCE, que sinaliza que sua política dovish está quase no fim, enquanto

Arief Makmur 14:48 2025-07-02 UTC+2

Previsão para o EUR/USD em 2 de julho de 2025

Assim, a cotação do euro alcançou o ponto X. Ontem à noite, no gráfico semanal, o preço atingiu o limite superior do canal de preços, um raio de Fibonacci

Laurie Bailey 14:44 2025-07-02 UTC+2

Previsão para o GBP/USD em 2 de julho de 2025

No gráfico diário, a linha de sinal do oscilador Marlin está se movendo para baixo de forma linear, ignorando a variação de preço de 120 pips. Isso sugere

Laurie Bailey 14:39 2025-07-02 UTC+2

Previsão para o AUD/USD em 2 de julho de 2025

No gráfico semanal, o dólar australiano rompeu uma resistência muito forte, formada pela linha do canal de preços e pela linha do MACD, especialmente no ponto de interseção entre ambas

Laurie Bailey 14:27 2025-07-02 UTC+2
Não pode falar agora?
Faça sua pergunta no chat.
Widget callback
 

Dear visitor,

Your IP address shows that you are currently located in the USA. If you are a resident of the United States, you are prohibited from using the services of InstaFintech Group including online trading, online transfers, deposit/withdrawal of funds, etc.

If you think you are seeing this message by mistake and your location is not the US, kindly proceed to the website. Otherwise, you must leave the website in order to comply with government restrictions.

Why does your IP address show your location as the USA?

  • - you are using a VPN provided by a hosting company based in the United States;
  • - your IP does not have proper WHOIS records;
  • - an error occurred in the WHOIS geolocation database.

Please confirm whether you are a US resident or not by clicking the relevant button below. If you choose the wrong option, being a US resident, you will not be able to open an account with InstaForex anyway.

We are sorry for any inconvenience caused by this message.