

signal strength 1 of 5
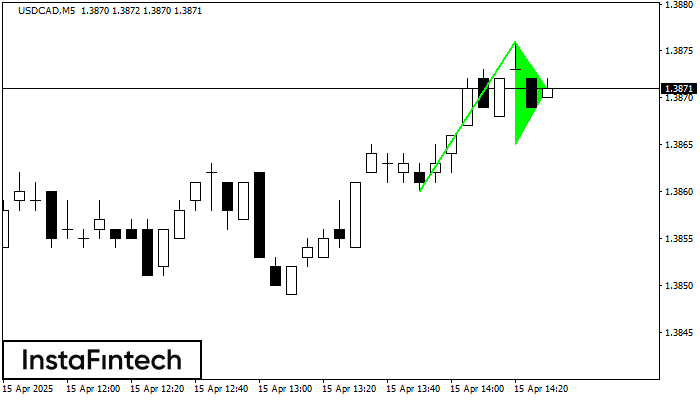
The Bullish pennant pattern is formed on the USDCAD M5 chart. It is a type of the continuation pattern. Supposedly, in case the price is fixed above the pennant’s high of 1.3876, a further uptrend is possible.
The M5 and M15 time frames may have more false entry points.
Veja também
- All
- Double Top
- Flag
- Head and Shoulders
- Pennant
- Rectangle
- Triangle
- Triple top
- All
- #AAPL
- #AMZN
- #Bitcoin
- #EBAY
- #FB
- #GOOG
- #INTC
- #KO
- #MA
- #MCD
- #MSFT
- #NTDOY
- #PEP
- #TSLA
- #TWTR
- AUDCAD
- AUDCHF
- AUDJPY
- AUDUSD
- EURCAD
- EURCHF
- EURGBP
- EURJPY
- EURNZD
- EURRUB
- EURUSD
- GBPAUD
- GBPCHF
- GBPJPY
- GBPUSD
- GOLD
- NZDCAD
- NZDCHF
- NZDJPY
- NZDUSD
- SILVER
- USDCAD
- USDCHF
- USDJPY
- USDRUB
- All
- M5
- M15
- M30
- H1
- D1
- All
- Buy
- Sale
- All
- 1
- 2
- 3
- 4
- 5
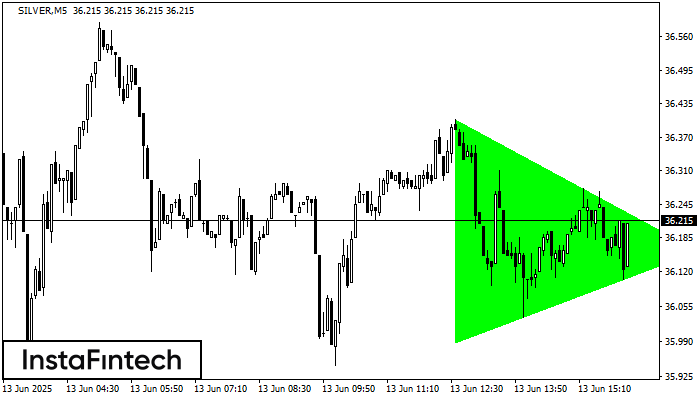
According to the chart of M5, SILVER formed the Bullish Symmetrical Triangle pattern. Description: This is the pattern of a trend continuation. 36.41 and 35.99 are the coordinates
The M5 and M15 time frames may have more false entry points.
Open chart in a new window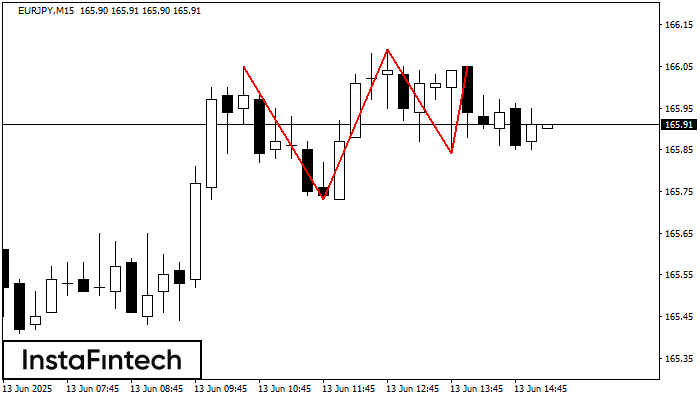
On the chart of the EURJPY M15 trading instrument, the Triple Top pattern that signals a trend change has formed. It is possible that after formation of the third peak
The M5 and M15 time frames may have more false entry points.
Open chart in a new window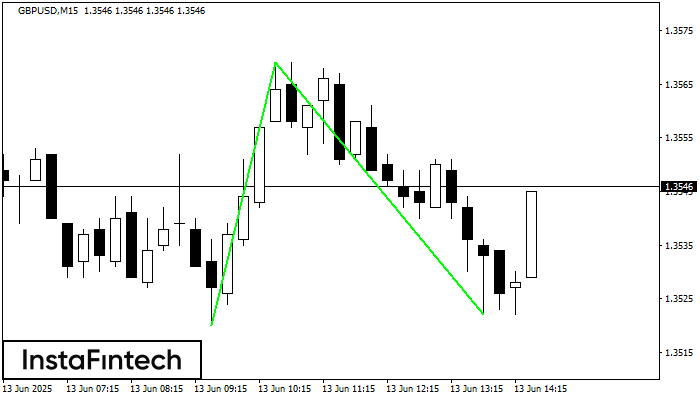
The Double Bottom pattern has been formed on GBPUSD M15. Characteristics: the support level 1.3520; the resistance level 1.3569; the width of the pattern 49 points. If the resistance level
The M5 and M15 time frames may have more false entry points.
Open chart in a new window


