signal strength 1 of 5

The Double Bottom pattern has been formed on EURNZD M5. Characteristics: the support level 1.8992; the resistance level 1.9020; the width of the pattern 28 points. If the resistance level is broken, a change in the trend can be predicted with the first target point lying at the distance of 26 points.
The M5 and M15 time frames may have more false entry points.
- All
- Double Top
- Flag
- Head and Shoulders
- Pennant
- Rectangle
- Triangle
- Triple top
- All
- #AAPL
- #AMZN
- #Bitcoin
- #EBAY
- #FB
- #GOOG
- #INTC
- #KO
- #MA
- #MCD
- #MSFT
- #NTDOY
- #PEP
- #TSLA
- #TWTR
- AUDCAD
- AUDCHF
- AUDJPY
- AUDUSD
- EURCAD
- EURCHF
- EURGBP
- EURJPY
- EURNZD
- EURRUB
- EURUSD
- GBPAUD
- GBPCHF
- GBPJPY
- GBPUSD
- GOLD
- NZDCAD
- NZDCHF
- NZDJPY
- NZDUSD
- SILVER
- USDCAD
- USDCHF
- USDJPY
- USDRUB
- All
- M5
- M15
- M30
- H1
- D1
- All
- Buy
- Sale
- All
- 1
- 2
- 3
- 4
- 5
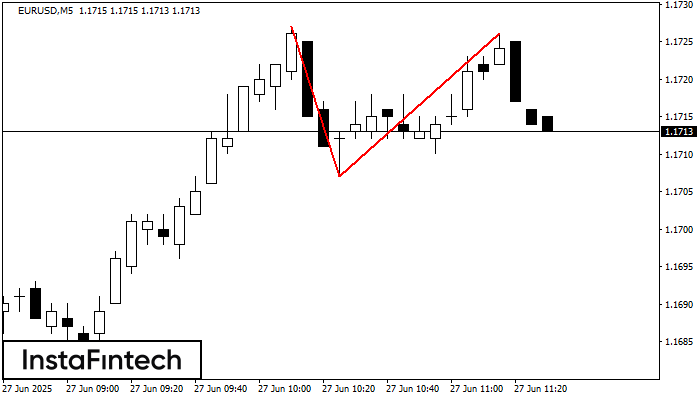
No gráfico de EURUSD M5 o padrão de reversão Topo duplo foi formado. Características: o limite superior 1.1726; o limite inferior 1.1707; a largura do padrão 19 pontos. O sinal
Os intervalos M5 e M15 podem ter mais pontos de entrada falsos.
Open chart in a new window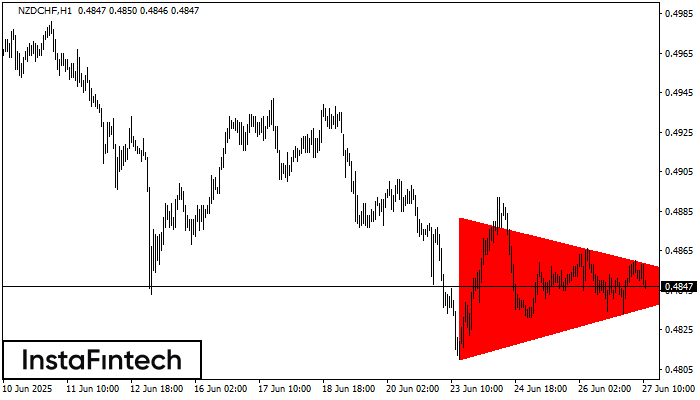
De acordo com o gráfico de H1, NZDCHF formou o padrão de Triângulo Simétrico de Baixa. Recomendações de negociação: Uma quebra do limite inferior de 0.4810 pode encorajar a continuação
Open chart in a new window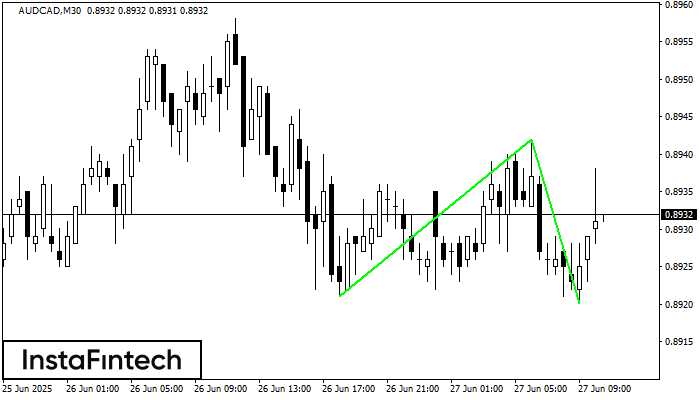
O padrão Fundo duplo foi formado em AUDCAD M30; o limite superior é 0.8942; o limite inferior é 0.8920. A largura do padrão é de 21 pontos. No caso
Open chart in a new window