signal strength 2 of 5
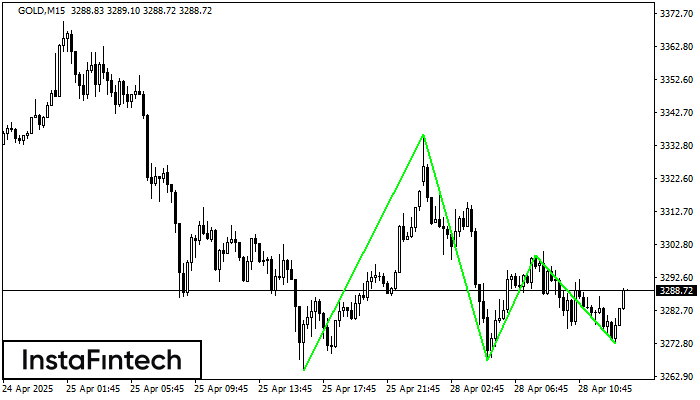
The Triple Bottom pattern has formed on the chart of the GOLD M15 trading instrument. The pattern signals a change in the trend from downwards to upwards in the case of breakdown of 3336.12/3299.36.
The M5 and M15 time frames may have more false entry points.
- All
- Double Top
- Flag
- Head and Shoulders
- Pennant
- Rectangle
- Triangle
- Triple top
- All
- #AAPL
- #AMZN
- #Bitcoin
- #EBAY
- #FB
- #GOOG
- #INTC
- #KO
- #MA
- #MCD
- #MSFT
- #NTDOY
- #PEP
- #TSLA
- #TWTR
- AUDCAD
- AUDCHF
- AUDJPY
- AUDUSD
- EURCAD
- EURCHF
- EURGBP
- EURJPY
- EURNZD
- EURRUB
- EURUSD
- GBPAUD
- GBPCHF
- GBPJPY
- GBPUSD
- GOLD
- NZDCAD
- NZDCHF
- NZDJPY
- NZDUSD
- SILVER
- USDCAD
- USDCHF
- USDJPY
- USDRUB
- All
- M5
- M15
- M30
- H1
- D1
- All
- Buy
- Sale
- All
- 1
- 2
- 3
- 4
- 5
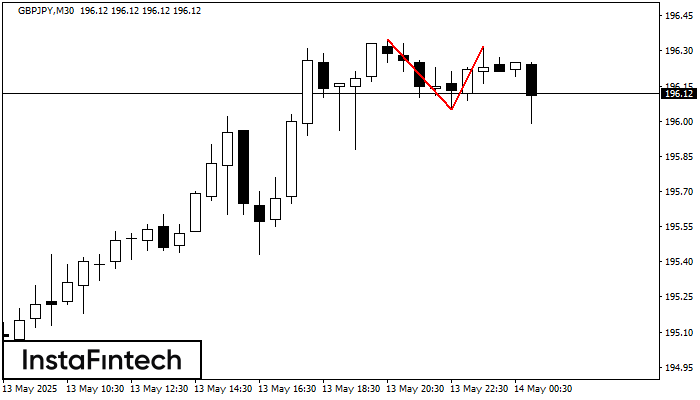
No gráfico de GBPJPY M30 o padrão de reversão Topo duplo foi formado. Características: o limite superior 196.32; o limite inferior 196.05; a largura do padrão 27 pontos. O sinal
Open chart in a new window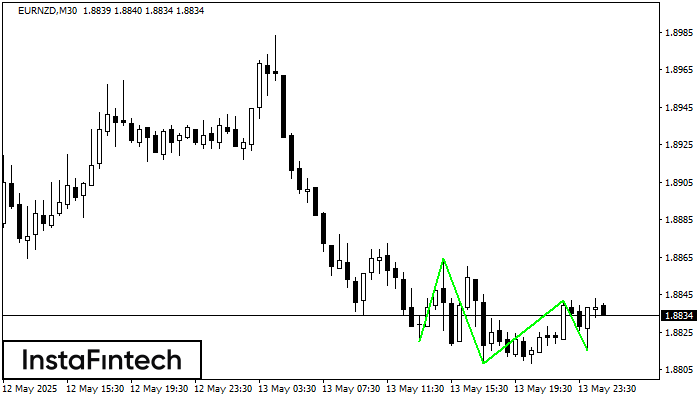
O padrão Fundo triplo foi formado em EURNZD M30. Possui as seguintes características: nível de resistência 1.8864/1.8842; nível de suporte 1.8820/1.8815; a largura é de 44 pontos. Se houver
Open chart in a new window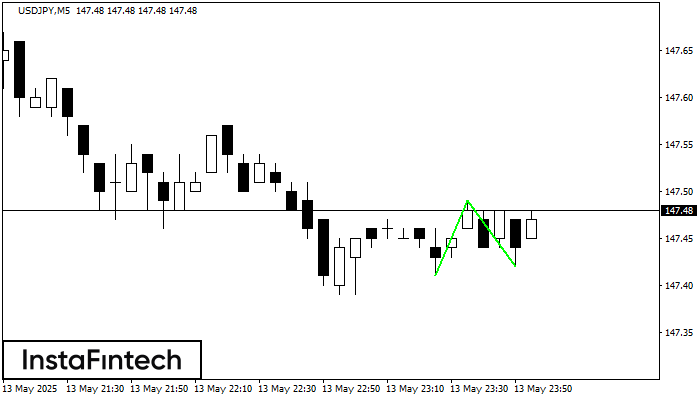
O padrão Fundo duplo foi formado em USDJPY M5. Características: o nível de suporte 147.41; o nível de resistência 147.49; a largura do padrão 8 pontos. Se o nível
Os intervalos M5 e M15 podem ter mais pontos de entrada falsos.
Open chart in a new window