


signal strength 3 of 5
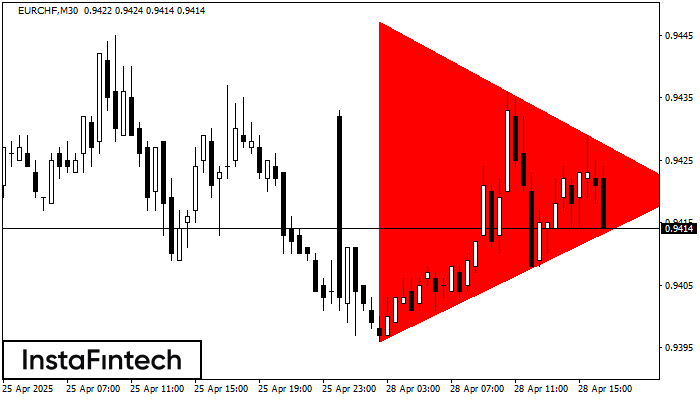
According to the chart of M30, EURCHF formed the Bearish Symmetrical Triangle pattern. Description: The lower border is 0.9396/0.9420 and upper border is 0.9447/0.9420. The pattern width is measured on the chart at -51 pips. The formation of the Bearish Symmetrical Triangle pattern evidently signals a continuation of the downward trend. In other words, if the scenario comes true and EURCHF breaches the lower border, the price could continue its move toward 0.9390.
Veja também
- All
- Double Top
- Flag
- Head and Shoulders
- Pennant
- Rectangle
- Triangle
- Triple top
- All
- #AAPL
- #AMZN
- #Bitcoin
- #EBAY
- #FB
- #GOOG
- #INTC
- #KO
- #MA
- #MCD
- #MSFT
- #NTDOY
- #PEP
- #TSLA
- #TWTR
- AUDCAD
- AUDCHF
- AUDJPY
- AUDUSD
- EURCAD
- EURCHF
- EURGBP
- EURJPY
- EURNZD
- EURRUB
- EURUSD
- GBPAUD
- GBPCHF
- GBPJPY
- GBPUSD
- GOLD
- NZDCAD
- NZDCHF
- NZDJPY
- NZDUSD
- SILVER
- USDCAD
- USDCHF
- USDJPY
- USDRUB
- All
- M5
- M15
- M30
- H1
- D1
- All
- Buy
- Sale
- All
- 1
- 2
- 3
- 4
- 5
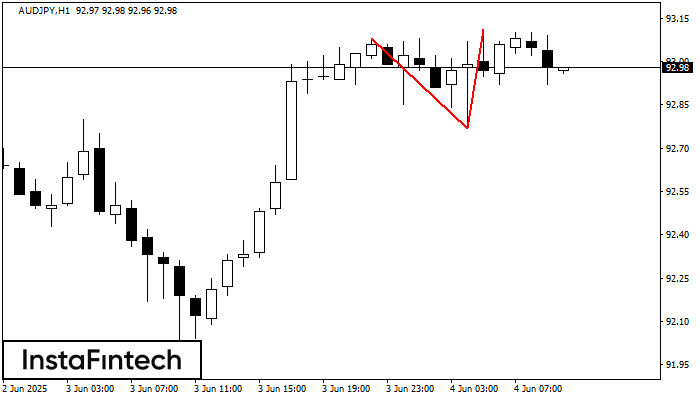
O padrão de reversão Topo duplo foi formado em AUDJPY H1. Características: o limite superior 93.08; o limite inferior 92.77; a largura do padrão é de 34 pontos. As operações
Open chart in a new window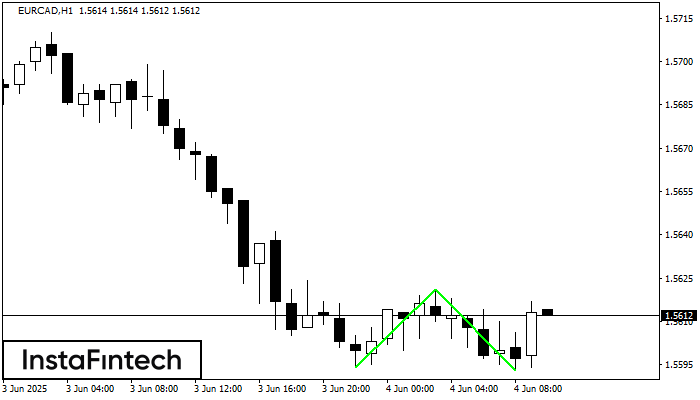
O padrão Fundo duplo foi formado em EURCAD H1. Esta formação sinaliza uma reversão da tendência de baixo para cima. O sinal é que uma negociação de compra deve
Open chart in a new window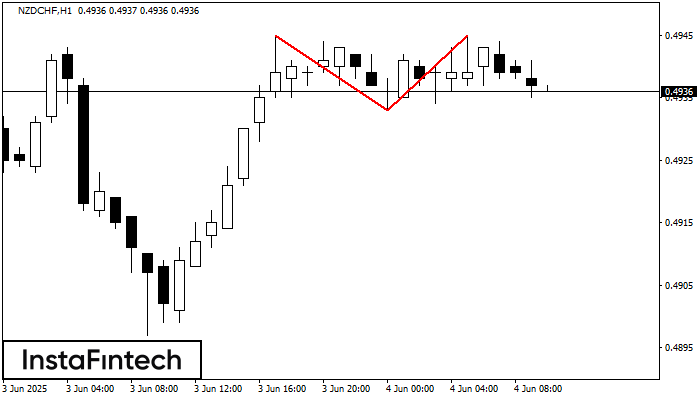
O padrão de reversão Topo duplo foi formado em NZDCHF H1. Características: o limite superior 0.4945; o limite inferior 0.4933; a largura do padrão é de 12 pontos. As operações
Open chart in a new window


