signal strength 1 of 5

The Bullish Flag pattern has been formed on the chart EURUSD M5 which signals that the upward trend will continue. Signals: а break of the peak at 1.0836 may push the price higher, and the rise will be the projection of the pole.
The M5 and M15 time frames may have more false entry points.
- All
- Double Top
- Flag
- Head and Shoulders
- Pennant
- Rectangle
- Triangle
- Triple top
- All
- #AAPL
- #AMZN
- #Bitcoin
- #EBAY
- #FB
- #GOOG
- #INTC
- #KO
- #MA
- #MCD
- #MSFT
- #NTDOY
- #PEP
- #TSLA
- #TWTR
- AUDCAD
- AUDCHF
- AUDJPY
- AUDUSD
- EURCAD
- EURCHF
- EURGBP
- EURJPY
- EURNZD
- EURRUB
- EURUSD
- GBPAUD
- GBPCHF
- GBPJPY
- GBPUSD
- GOLD
- NZDCAD
- NZDCHF
- NZDJPY
- NZDUSD
- SILVER
- USDCAD
- USDCHF
- USDJPY
- USDRUB
- All
- M5
- M15
- M30
- H1
- D1
- All
- Buy
- Sale
- All
- 1
- 2
- 3
- 4
- 5
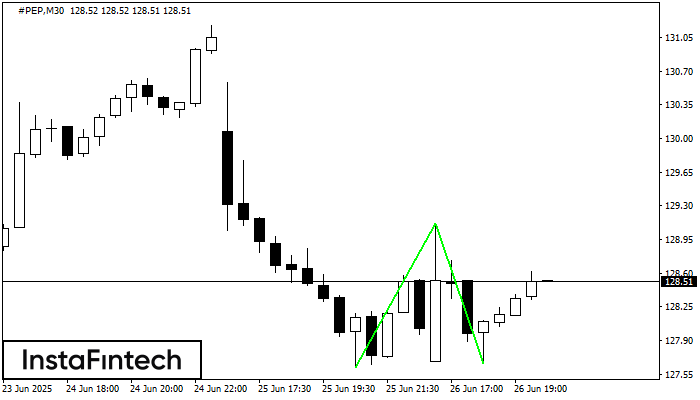
The Double Bottom pattern has been formed on #PEP M30. Characteristics: the support level 127.62; the resistance level 129.12; the width of the pattern 150 points. If the resistance level
Open chart in a new window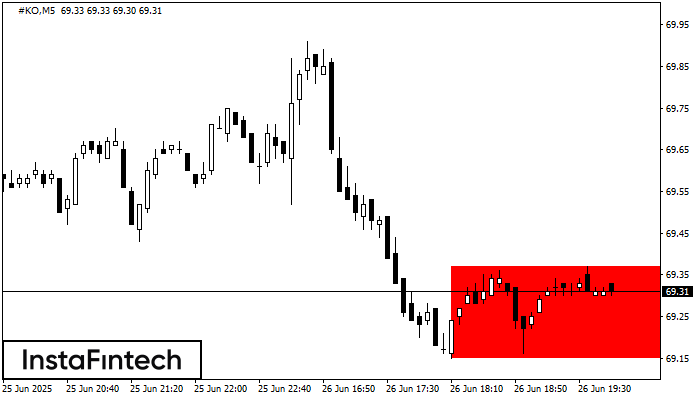
According to the chart of M5, #KO formed the Bearish Rectangle. The pattern indicates a trend continuation. The upper border is 69.37, the lower border is 69.15. The signal means
The M5 and M15 time frames may have more false entry points.
Open chart in a new window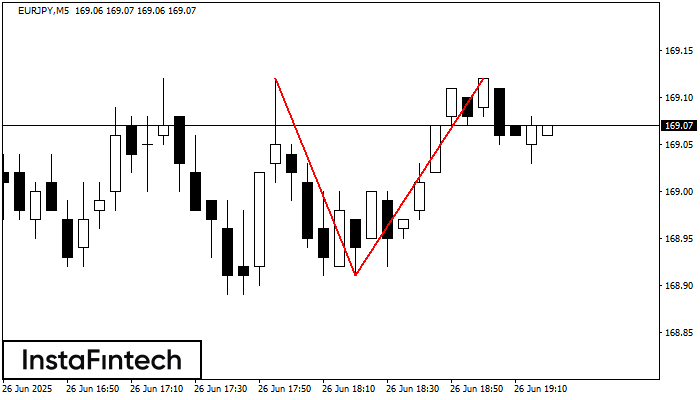
On the chart of EURJPY M5 the Double Top reversal pattern has been formed. Characteristics: the upper boundary 169.12; the lower boundary 168.91; the width of the pattern 21 points
The M5 and M15 time frames may have more false entry points.
Open chart in a new window