signal strength 1 of 5

According to the chart of M5, EURCAD formed the Head and Shoulders pattern. The Head’s top is set at 1.5811 while the median line of the Neck is found at 1.5747/1.5755. The formation of the Head and Shoulders pattern evidently signals a reversal of the upward trend. In other words, in case the scenario comes true, the price of EURCAD will go towards 1.5740.
The M5 and M15 time frames may have more false entry points.
- All
- Double Top
- Flag
- Head and Shoulders
- Pennant
- Rectangle
- Triangle
- Triple top
- All
- #AAPL
- #AMZN
- #Bitcoin
- #EBAY
- #FB
- #GOOG
- #INTC
- #KO
- #MA
- #MCD
- #MSFT
- #NTDOY
- #PEP
- #TSLA
- #TWTR
- AUDCAD
- AUDCHF
- AUDJPY
- AUDUSD
- EURCAD
- EURCHF
- EURGBP
- EURJPY
- EURNZD
- EURRUB
- EURUSD
- GBPAUD
- GBPCHF
- GBPJPY
- GBPUSD
- GOLD
- NZDCAD
- NZDCHF
- NZDJPY
- NZDUSD
- SILVER
- USDCAD
- USDCHF
- USDJPY
- USDRUB
- All
- M5
- M15
- M30
- H1
- D1
- All
- Buy
- Sale
- All
- 1
- 2
- 3
- 4
- 5
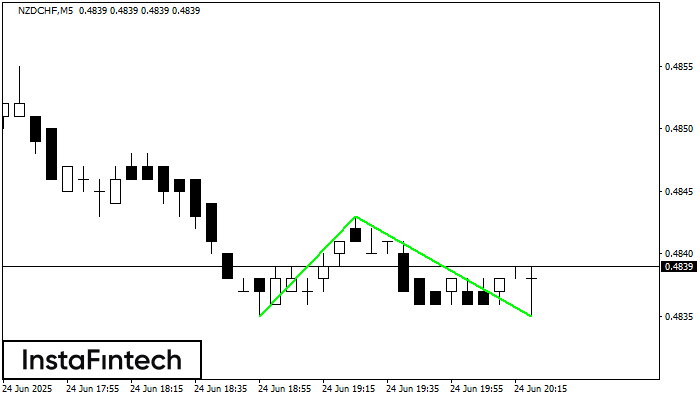
The Double Bottom pattern has been formed on NZDCHF M5; the upper boundary is 0.4843; the lower boundary is 0.4835. The width of the pattern is 8 points. In case
The M5 and M15 time frames may have more false entry points.
Open chart in a new window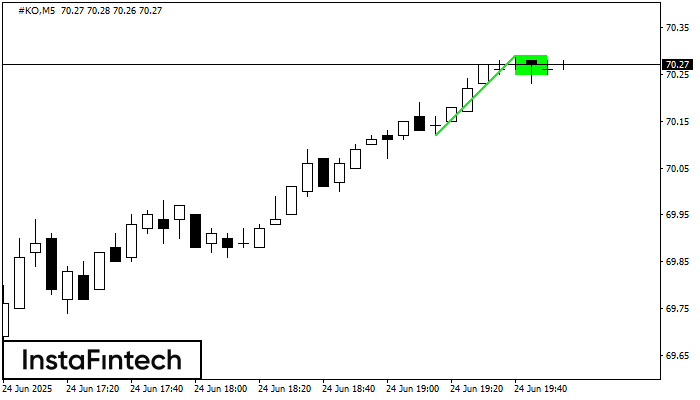
The Bullish Flag pattern has been formed on the chart #KO M5 which signals that the upward trend will continue. Signals: а break of the peak at 70.29 may push
The M5 and M15 time frames may have more false entry points.
Open chart in a new window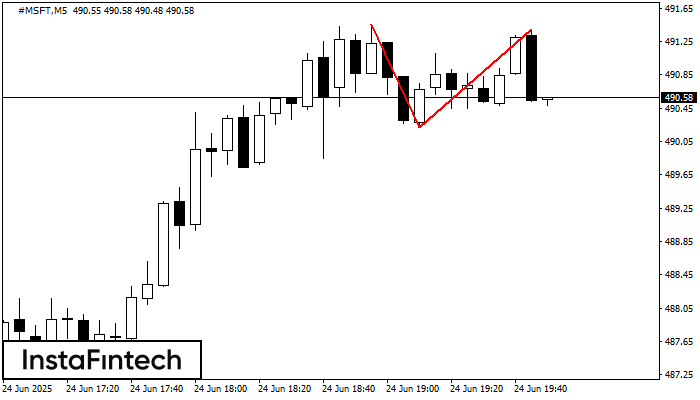
The Double Top reversal pattern has been formed on #MSFT M5. Characteristics: the upper boundary 491.46; the lower boundary 490.22; the width of the pattern is 118 points. Sell trades
The M5 and M15 time frames may have more false entry points.
Open chart in a new window