signal strength 1 of 5

The Bullish Flag pattern has been formed on USDCAD at M5. The lower boundary of the pattern is located at 1.3870/1.3862, while the higher boundary lies at 1.3876/1.3868. The projection of the flagpole is 16 points. This formation signals that the upward trend is most likely to continue. Therefore, if the level of 1.3876 is broken, the price will move further upwards.
The M5 and M15 time frames may have more false entry points.
See Also
- All
- Double Top
- Flag
- Head and Shoulders
- Pennant
- Rectangle
- Triangle
- Triple top
- All
- #AAPL
- #AMZN
- #Bitcoin
- #EBAY
- #FB
- #GOOG
- #INTC
- #KO
- #MA
- #MCD
- #MSFT
- #NTDOY
- #PEP
- #TSLA
- #TWTR
- AUDCAD
- AUDCHF
- AUDJPY
- AUDUSD
- EURCAD
- EURCHF
- EURGBP
- EURJPY
- EURNZD
- EURRUB
- EURUSD
- GBPAUD
- GBPCHF
- GBPJPY
- GBPUSD
- GOLD
- NZDCAD
- NZDCHF
- NZDJPY
- NZDUSD
- SILVER
- USDCAD
- USDCHF
- USDJPY
- USDRUB
- All
- M5
- M15
- M30
- H1
- D1
- All
- Buy
- Sale
- All
- 1
- 2
- 3
- 4
- 5
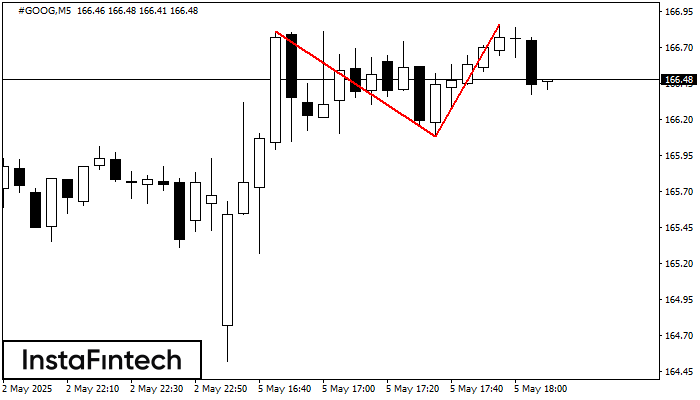
The Double Top reversal pattern has been formed on #GOOG M5. Characteristics: the upper boundary 166.81; the lower boundary 166.08; the width of the pattern is 78 points. Sell trades
The M5 and M15 time frames may have more false entry points.
Open chart in a new window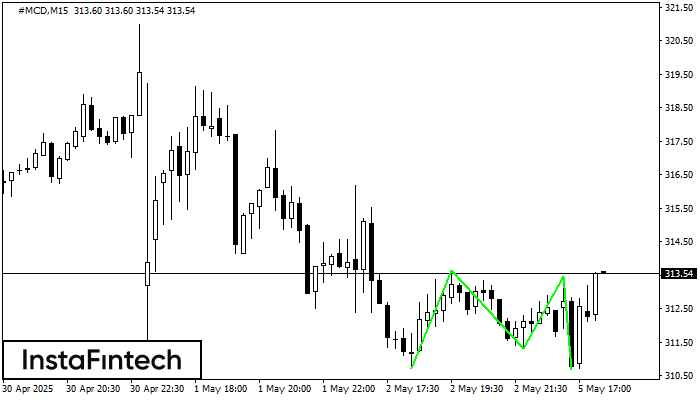
The Triple Bottom pattern has formed on the chart of the #MCD M15 trading instrument. The pattern signals a change in the trend from downwards to upwards in the case
The M5 and M15 time frames may have more false entry points.
Open chart in a new window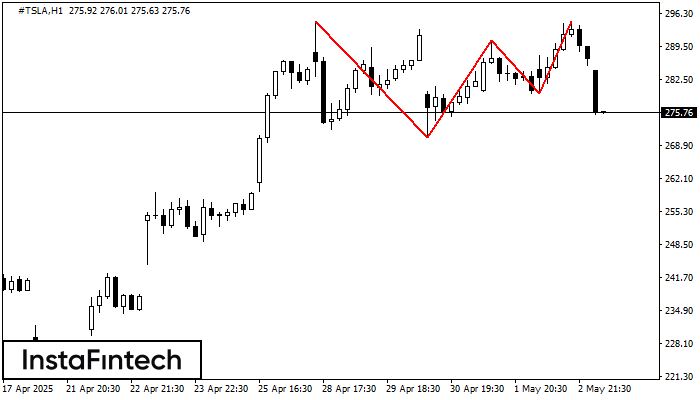
The Triple Top pattern has formed on the chart of the #TSLA H1. Features of the pattern: borders have an ascending angle; the lower line of the pattern
Open chart in a new window