

Actual patterns
Patterns are graphical models which are formed in the chart by the price. According to one of the technical analysis postulates, history (price movement) repeats itself. It means that the price movements are often similar in the same situations which makes it possible to predict the further development of the situation with a high probability.
Actual Patterns
- All
- Double Top
- Flag
- Head and Shoulders
- Pennant
- Rectangle
- Triangle
- Triple top
- All
- #AAPL
- #AMZN
- #Bitcoin
- #EBAY
- #FB
- #GOOG
- #INTC
- #KO
- #MA
- #MCD
- #MSFT
- #NTDOY
- #PEP
- #TSLA
- #TWTR
- AUDCAD
- AUDCHF
- AUDJPY
- AUDUSD
- EURCAD
- EURCHF
- EURGBP
- EURJPY
- EURNZD
- EURRUB
- EURUSD
- GBPAUD
- GBPCHF
- GBPJPY
- GBPUSD
- GOLD
- NZDCAD
- NZDCHF
- NZDJPY
- NZDUSD
- SILVER
- USDCAD
- USDCHF
- USDJPY
- USDRUB
- All
- M5
- M15
- M30
- H1
- D1
- All
- Buy
- Sale
- All
- 1
- 2
- 3
- 4
- 5
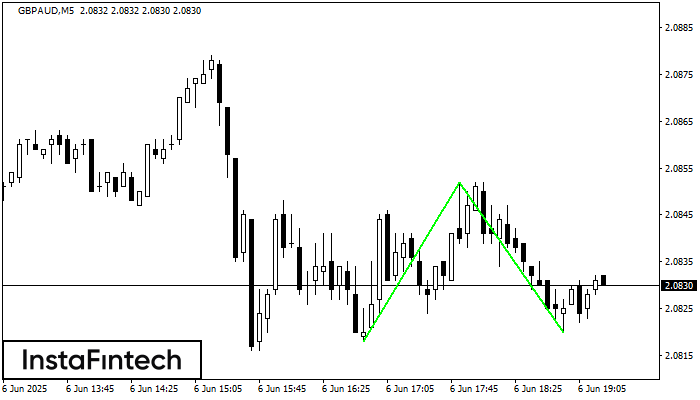
The Double Bottom pattern has been formed on GBPAUD M5; the upper boundary is 2.0852; the lower boundary is 2.0820. The width of the pattern is 34 points. In case
The M5 and M15 time frames may have more false entry points.
Open chart in a new window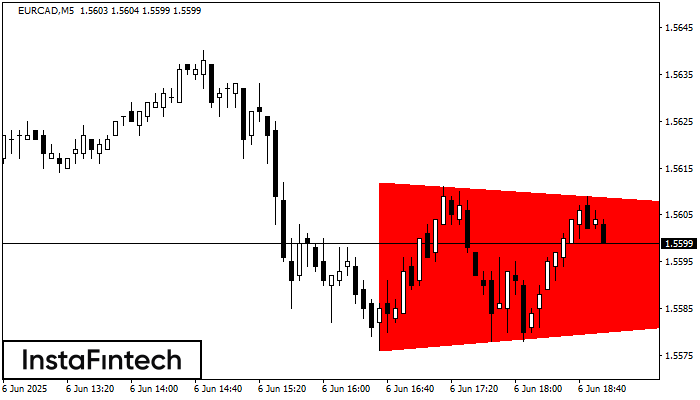
According to the chart of M5, EURCAD formed the Bearish Symmetrical Triangle pattern. This pattern signals a further downward trend in case the lower border 1.5576 is breached. Here
The M5 and M15 time frames may have more false entry points.
Open chart in a new window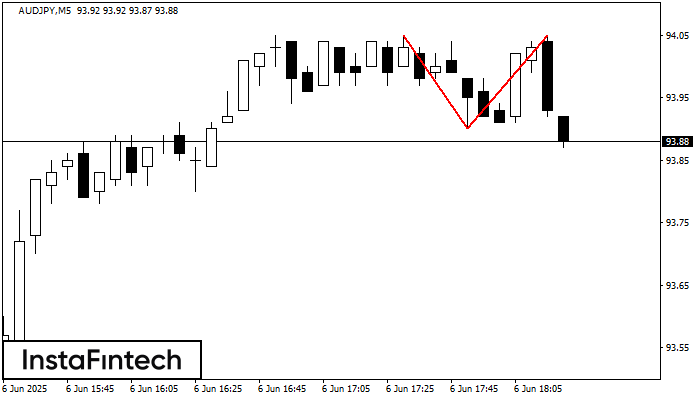
On the chart of AUDJPY M5 the Double Top reversal pattern has been formed. Characteristics: the upper boundary 94.05; the lower boundary 93.90; the width of the pattern 15 points
The M5 and M15 time frames may have more false entry points.
Open chart in a new window


