signal strength 2 of 5
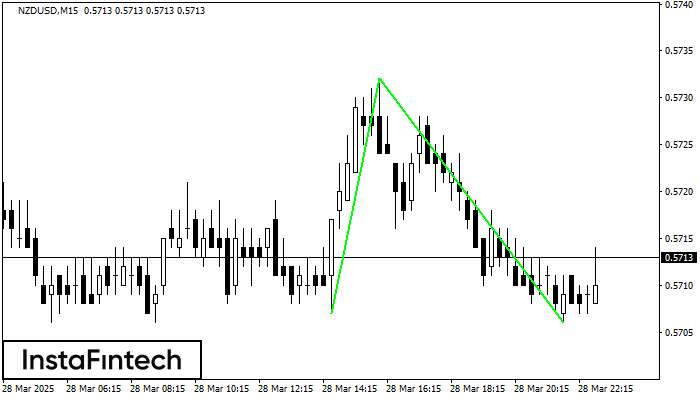
The Double Bottom pattern has been formed on NZDUSD M15; the upper boundary is 0.5732; the lower boundary is 0.5706. The width of the pattern is 25 points. In case of a break of the upper boundary 0.5732, a change in the trend can be predicted where the width of the pattern will coincide with the distance to a possible take profit level.
The M5 and M15 time frames may have more false entry points.
See Also
- All
- Double Top
- Flag
- Head and Shoulders
- Pennant
- Rectangle
- Triangle
- Triple top
- All
- #AAPL
- #AMZN
- #Bitcoin
- #EBAY
- #FB
- #GOOG
- #INTC
- #KO
- #MA
- #MCD
- #MSFT
- #NTDOY
- #PEP
- #TSLA
- #TWTR
- AUDCAD
- AUDCHF
- AUDJPY
- AUDUSD
- EURCAD
- EURCHF
- EURGBP
- EURJPY
- EURNZD
- EURRUB
- EURUSD
- GBPAUD
- GBPCHF
- GBPJPY
- GBPUSD
- GOLD
- NZDCAD
- NZDCHF
- NZDJPY
- NZDUSD
- SILVER
- USDCAD
- USDCHF
- USDJPY
- USDRUB
- All
- M5
- M15
- M30
- H1
- D1
- All
- Buy
- Sale
- All
- 1
- 2
- 3
- 4
- 5
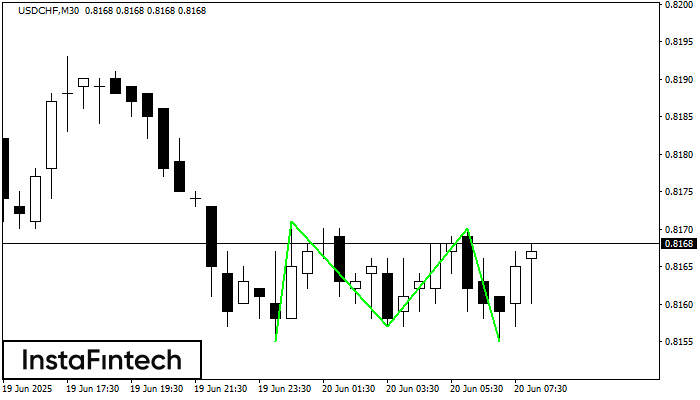
The Triple Bottom pattern has been formed on USDCHF M30. It has the following characteristics: resistance level 0.8171/0.8170; support level 0.8155/0.8155; the width is 16 points. In the event
Открыть график инструмента в новом окне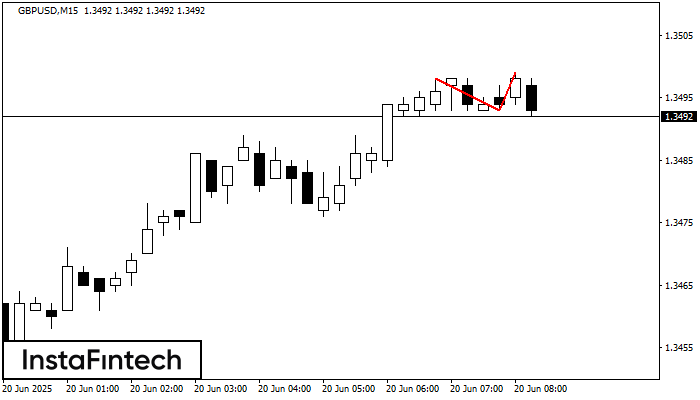
The Double Top pattern has been formed on GBPUSD M15. It signals that the trend has been changed from upwards to downwards. Probably, if the base of the pattern 1.3493
The M5 and M15 time frames may have more false entry points.
Открыть график инструмента в новом окне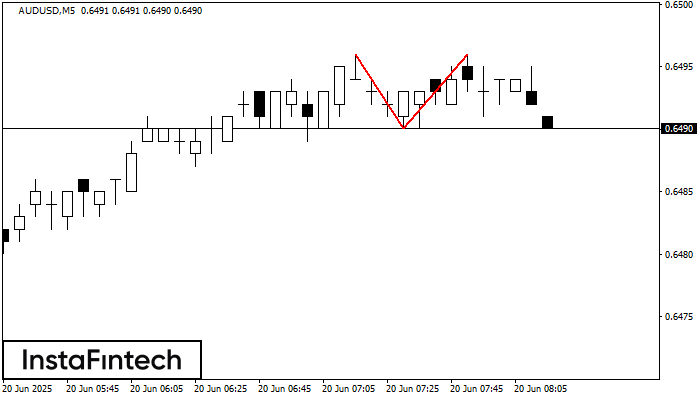
The Double Top pattern has been formed on AUDUSD M5. It signals that the trend has been changed from upwards to downwards. Probably, if the base of the pattern 0.6490
The M5 and M15 time frames may have more false entry points.
Открыть график инструмента в новом окне