signal strength 2 of 5

The Bearish Flag pattern has been formed on the chart #TSLA M15 which signals that the downward trend will continue. If the price breaks below the low at 235.81, then it is most likely to move further downwards. The price will likely move by the number of points which equals the length of the flag pole (15 points).
The M5 and M15 time frames may have more false entry points.
- All
- Double Top
- Flag
- Head and Shoulders
- Pennant
- Rectangle
- Triangle
- Triple top
- All
- #AAPL
- #AMZN
- #Bitcoin
- #EBAY
- #FB
- #GOOG
- #INTC
- #KO
- #MA
- #MCD
- #MSFT
- #NTDOY
- #PEP
- #TSLA
- #TWTR
- AUDCAD
- AUDCHF
- AUDJPY
- AUDUSD
- EURCAD
- EURCHF
- EURGBP
- EURJPY
- EURNZD
- EURRUB
- EURUSD
- GBPAUD
- GBPCHF
- GBPJPY
- GBPUSD
- GOLD
- NZDCAD
- NZDCHF
- NZDJPY
- NZDUSD
- SILVER
- USDCAD
- USDCHF
- USDJPY
- USDRUB
- All
- M5
- M15
- M30
- H1
- D1
- All
- Buy
- Sale
- All
- 1
- 2
- 3
- 4
- 5

O padrão Fundo duplo foi formado em #PEP D1; o limite superior é 132.72; o limite inferior é 129.16. A largura do padrão é de 365 pontos. No caso
Open chart in a new window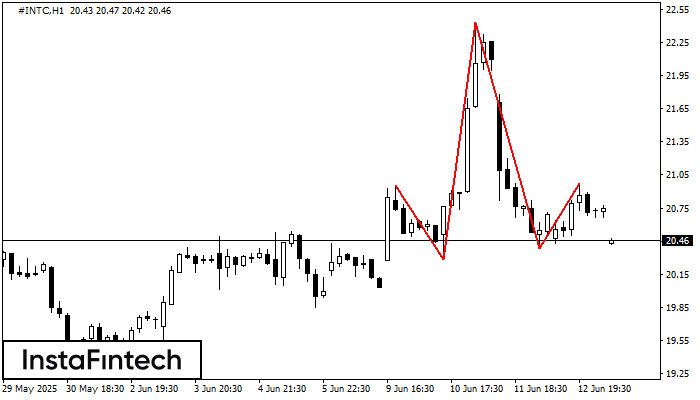
Os #INTC H1 formaram o padrão Cabeça & Ombros com as seguintes características: O topo da cabeça está em 22.43, a linha do pescoço e o ângulo para cima estão
Open chart in a new window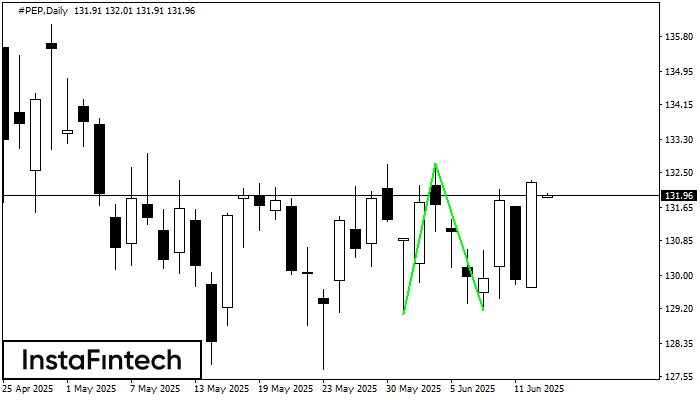
O padrão Fundo duplo foi formado em #PEP D1; o limite superior é 132.72; o limite inferior é 129.16. A largura do padrão é de 365 pontos. No caso
Open chart in a new window