empty
10.03.2025 01:32 PM
Forecast for EUR/USD on March 10, 2025

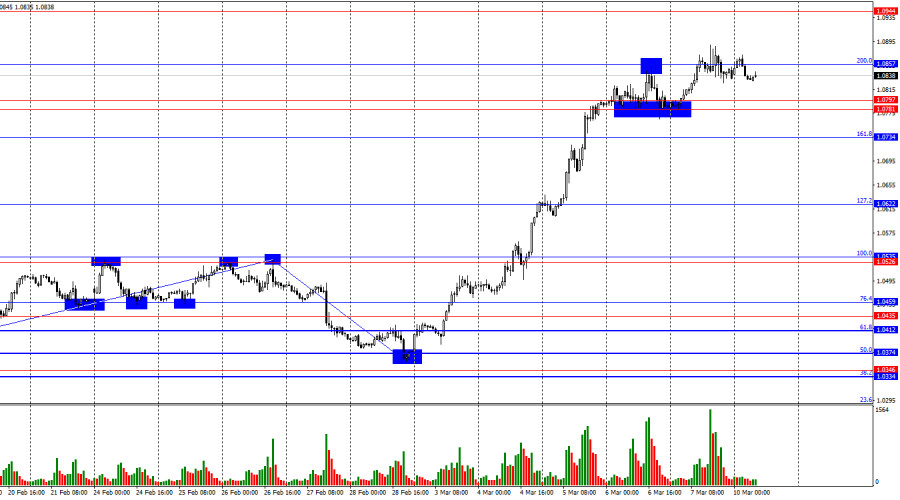
On Friday, EUR/USD attempted to extend its upward movement and consolidate above the 200.0% Fibonacci retracement level at 1.0857, but bulls lacked the momentum to sustain the breakout. However, a successful close above this level would strengthen the case for further growth toward 1.0944. If the pair rebounds from 1.0857, it could favor the U.S. dollar and trigger a mild and short-lived pullback.

This image is no longer relevant

The wave structure on the hourly chart has shifted. The last completed downward wave broke the previous low, while the new upward wave broke the previous high. This indicates that the market is no longer in a sideways trend but rather in a bullish phase. However, the current growth appears impulsive, with buyers aggressively pushing higher due to concerns over a potential U.S. economic slowdown driven by Donald Trump's policies. This fear-driven sentiment remains the primary reason for the dollar's decline last week.

On Friday, the market's bias continued to support buyers, although it would be misleading to say that the sentiment had been consistently bullish throughout the week. For example, on Thursday, the ECB announced another round of monetary easing, which initially supported bearish traders. However, by Friday, the U.S. unemployment rate had risen, and the Nonfarm Payrolls (NFP) report fell short of market expectations. Still, as I mentioned earlier, bulls seemed to have exhausted their strength.

Under these conditions, a corrective wave would be logical, but I lack confidence that dollar buyers are present in the market right now. Last week, Trump's policies sent shockwaves through the markets, leading many traders to anticipate economic deterioration rather than improvement. Additionally, market participants now expect the Fed to cut rates at least twice by year-end. Even Jerome Powell's speech on Friday failed to change the sentiment.

The FOMC Chair stated that there is currently no reason to alter the Fed's monetary policy stance, but he acknowledged that economic risks have increased. While the U.S. dollar enjoyed a strong end to 2024 and the beginning of 2025, its outlook is now increasingly uncertain.

This image is no longer relevant

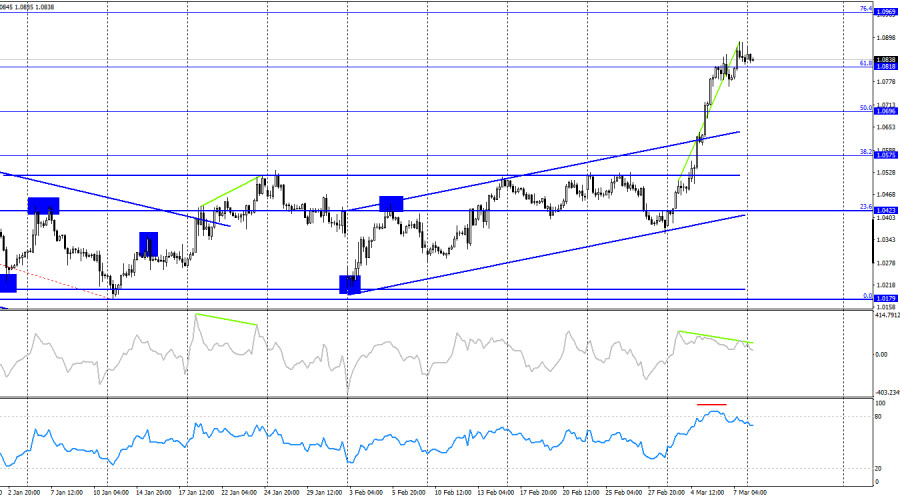
On the 4-hour chart, EUR/USD continues its bullish trend after breaking out of a horizontal channel. The upward trend channel confirms the uptrend, while the break above the 61.8% Fibonacci level at 1.0818 suggests further upside potential toward 76.4% at 1.0969.

However, the CCI indicator has formed a bearish divergence, and the RSI is signaling overbought conditions, indicating that the pair may be preparing for a pullback. If EUR/USD closes below 1.0818, a decline toward the 50.0% Fibonacci retracement at 1.0696 could follow.

Commitments of Traders (COT) Report

This image is no longer relevant

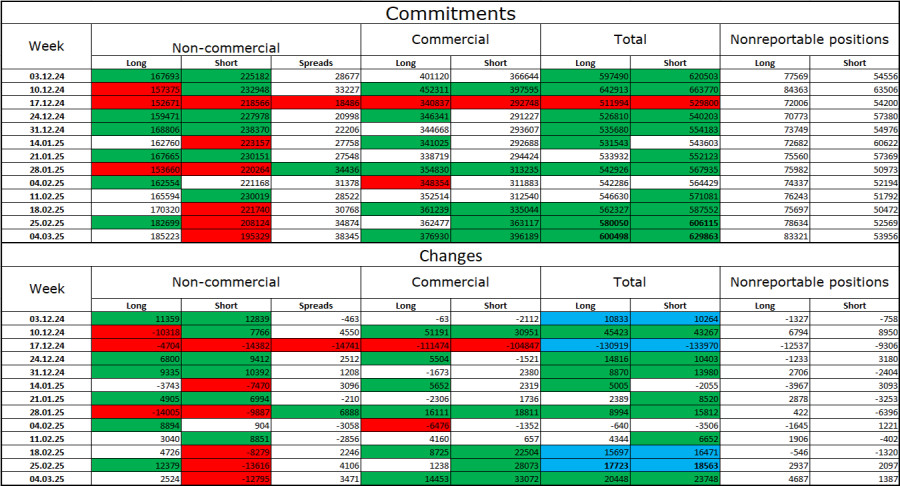
During the latest reporting week, institutional traders opened 2,524 new long positions and closed 12,795 short positions. Although the Non-commercial group remains bearish, their stance has softened in recent weeks. Total long positions now stand at 185,000 and total short positions stand at 195,000.

For 20 consecutive weeks, institutional traders have been reducing their euro holdings, reinforcing the prevailing bearish trend. The monetary policy divergence between the ECB and the Fed still favors the U.S. dollar, despite recent adjustments.

However, bearish dominance is weakening, and the number of long positions has increased for five straight weeks—a period that coincides with Donald Trump's presidency. This shift raises questions about whether market sentiment toward the euro is truly changing.

Economic Calendar for the U.S. and Eurozone

  • Eurozone – German Industrial Production Change (07:00 UTC).

On March 10, only one minor economic release is scheduled, meaning the impact of fundamental factors on market sentiment will be minimal.

EUR/USD Forecast and Trading Recommendations

Selling opportunities arise if the pair closes below the 1.0781–1.0797 range on the hourly chart, with downward targets at 1.0734 and 1.0622. Another selling opportunity could emerge if the pair rebounds from 1.0857. Buying opportunities exist, but the pair's strong and uninterrupted rally raises concerns about a potential sharp reversal.

Fibonacci retracement levels:

  • Hourly chart: Based on the 1.0529–1.0213 range.
  • 4-hour chart: Based on the 1.1214–1.0179 range.
Seleccione el marco de tiempo
5
min
15
min
30
min
1
hora
4
horas
1
día
1
s.
Gana con los cambios en el valor de las criptomonedas con InstaForex.
Descarga MetaTrader 4 y abre tu primera operación.
  • Grand Choice
    Contest by
    InstaForex
    InstaForex always strives to help you
    fulfill your biggest dreams.
    UNIRSE AL CONCURSO

Recommended Stories

Pronóstico para el gas al 8 de abril de 2025

Gas natural (NG) Ni al final de la semana pasada, ni mucho menos al comienzo de la actual, la cotización del gas natural logró superar la resistencia de 4.200, reforzada

Laurie Bailey 08:11 2025-04-08 UTC+2

Pronóstico del gas para el 17 de marzo de 2025

Gas natural (NG) La jornada de hoy se abrió por encima de la línea indicadora Kruzenshtern en el marco diario. Al mismo tiempo, el oscilador Marlin cambió de dirección hacia

Laurie Bailey 07:02 2025-03-17 UTC+2

Pronóstico para el Bitcoin el 21 de febrero de 2025

Bitcoin El Bitcoin ha cambiado de opinión sobre el desarrollo de una caída hacia soportes objetivos cómodos, y en su lugar, siguiendo el sentimiento de riesgo general, ha revertido desde

Laurie Bailey 07:23 2025-02-21 UTC+2

Bitcoin - análisis técnico de la situación

Viernes, y el Bitcoin sigue esperando. Ninguna de las partes enfrentadas tiene prisa por presentarse y ser activa. En la incertidumbre actual, el posicionamiento de los principales índices de referencia

Evangelos Poulakis 07:45 2025-02-14 UTC+2

Previsión para el gas natural (GN) del 5 de febrero de 2025

En el gráfico semanal la semana pasada el precio se revirtió desde el nivel de soporte 3.017 - desde los máximos de septiembre 2024, agosto 2023, febrero 2023 y también

Laurie Bailey 07:51 2025-02-05 UTC+2

#NDX - análisis técnico de la situación

A finales del año pasado, el índice marcó un nuevo máximo histórico (22141), tras lo cual se detuvo la subida, comenzó la formación de la corrección y la consolidación. Ahora

Evangelos Poulakis 07:24 2025-02-04 UTC+2

Bitcoin 30 Enero - análisis técnico de la situación

A pesar de marcar un nuevo máximo la semana pasada (109986), el Bitcoin detuvo su tendencia alcista y comenzó a formar incertidumbre. Hasta ahora, el formato semanal ha proyectado

Evangelos Poulakis 07:24 2025-01-30 UTC+2

#SPX (contrato CFD sobre futuros del SP500). Esperamos que la subida continúe

El contrato CFD sobre futuros del S&P 500 se recupera vigorosamente tras una caída local del lunes por la oleada de noticias sobre el éxito de la empresa china DeepSeek

Pati Gani 11:06 2025-01-29 UTC+2

Nasdaq 100. Se esperan nuevos máximos históricos

La toma de posesión hoy de Donald Trump marcará el inicio del segundo mandato de su presidencia, acompañado de promesas de reforzar la posición de EE. UU. en la escena

Anna Zotova 10:00 2025-01-20 UTC+2

Bitcoin – análisis técnico de la situación

El año pasado los principales logros y ventajas estuvieron del lado de los compradores. El año 2024 les trajo un nuevo máximo histórico (108362,36), superando el máximo anterior registrado

Evangelos Poulakis 06:55 2025-01-20 UTC+2
¿No puede hablar ahora mismo?
Ingrese su pregunta en el chat.
Widget callback
 

Dear visitor,

Your IP address shows that you are currently located in the USA. If you are a resident of the United States, you are prohibited from using the services of InstaFintech Group including online trading, online transfers, deposit/withdrawal of funds, etc.

If you think you are seeing this message by mistake and your location is not the US, kindly proceed to the website. Otherwise, you must leave the website in order to comply with government restrictions.

Why does your IP address show your location as the USA?

  • - you are using a VPN provided by a hosting company based in the United States;
  • - your IP does not have proper WHOIS records;
  • - an error occurred in the WHOIS geolocation database.

Please confirm whether you are a US resident or not by clicking the relevant button below. If you choose the wrong option, being a US resident, you will not be able to open an account with InstaForex anyway.

We are sorry for any inconvenience caused by this message.