signal strength 1 of 5
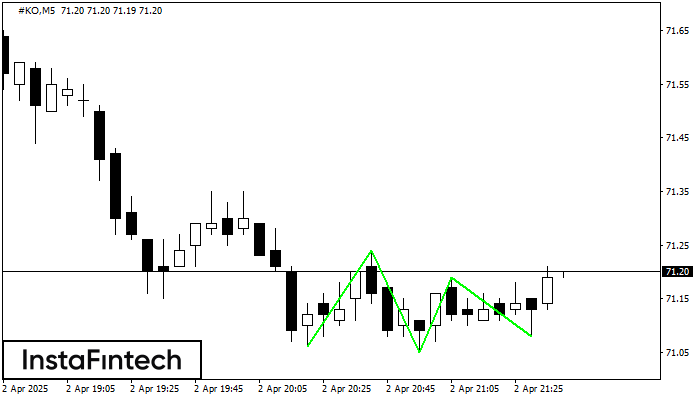
The Triple Bottom pattern has formed on the chart of #KO M5. Features of the pattern: The lower line of the pattern has coordinates 71.24 with the upper limit 71.24/71.19, the projection of the width is 18 points. The formation of the Triple Bottom pattern most likely indicates a change in the trend from downward to upward. This means that in the event of a breakdown of the resistance level 71.06, the price is most likely to continue the upward movement.
The M5 and M15 time frames may have more false entry points.
Vea asimismo
- All
- Double Top
- Flag
- Head and Shoulders
- Pennant
- Rectangle
- Triangle
- Triple top
- All
- #AAPL
- #AMZN
- #Bitcoin
- #EBAY
- #FB
- #GOOG
- #INTC
- #KO
- #MA
- #MCD
- #MSFT
- #NTDOY
- #PEP
- #TSLA
- #TWTR
- AUDCAD
- AUDCHF
- AUDJPY
- AUDUSD
- EURCAD
- EURCHF
- EURGBP
- EURJPY
- EURNZD
- EURRUB
- EURUSD
- GBPAUD
- GBPCHF
- GBPJPY
- GBPUSD
- GOLD
- NZDCAD
- NZDCHF
- NZDJPY
- NZDUSD
- SILVER
- USDCAD
- USDCHF
- USDJPY
- USDRUB
- All
- M5
- M15
- M30
- H1
- D1
- All
- Buy
- Sale
- All
- 1
- 2
- 3
- 4
- 5
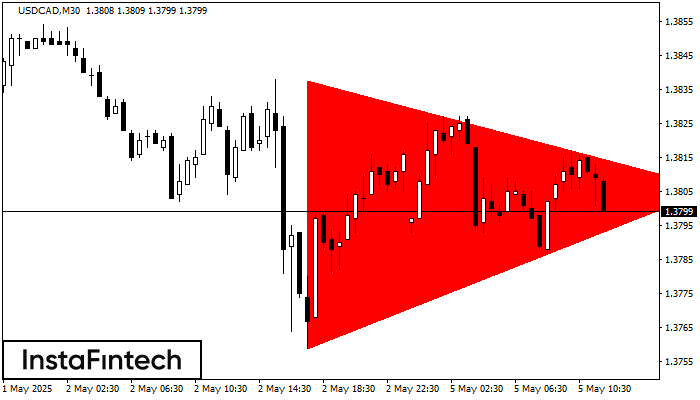
Según el gráfico de M30, el USDCAD formó el patrón Triángulo Simétrico Bajista. Recomendaciones de negociación: es posible que una ruptura del límite inferior 1.3759 fomente una continuación
Open chart in a new window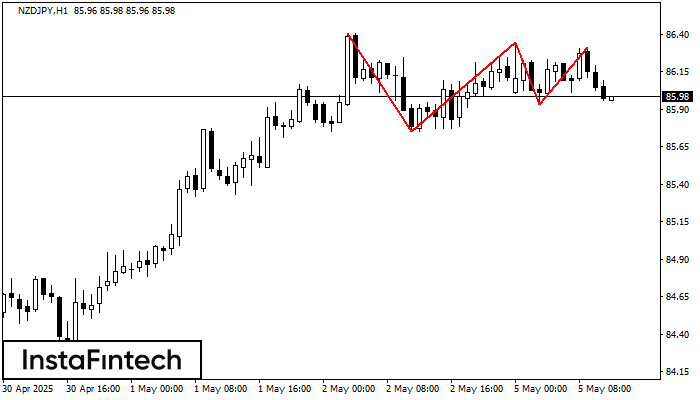
El patrón Triple Techo ha sido formado en el gráfico de NZDJPY H1. Características del patrón: los límites tienen un ángulo ascendente, la línea inferior del patrón tiene coordenadas 85.75/85.93
Open chart in a new window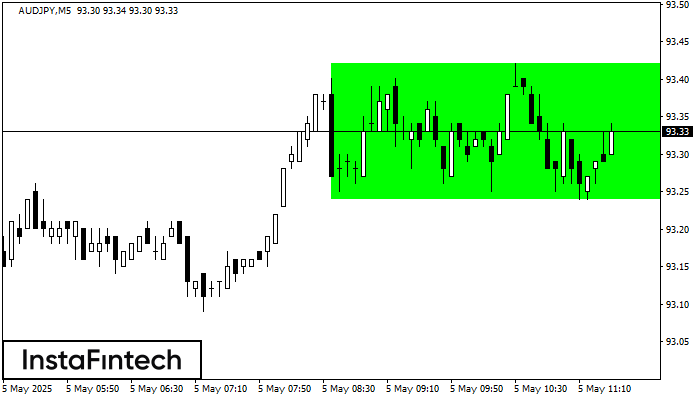
Según el gráfico de M5, AUDJPY formó el Rectángulo Alcista. El patrón indica la continuación de una tendencia. El límite superior es 93.42, el límite inferior es 93.24. La señal
Los marcos de tiempo M5 y M15 pueden tener más puntos de entrada falsos.
Open chart in a new window