empty
11.02.2020 01:29 AM
Comprehensive analysis of movement options for #USDX vs EUR/USD vs GBP/USD vs USD/JPY (DAILY) on February 10

Here's a variation of movement of the main currency instruments - #USDX, EUR / USD, GBP / USD and USD / JPY - DAILY in a comprehensive form from February 10, 2020

Minor (daily time frame)

____________________

US dollar index

The US dollar index #USDX will determine the development of its movement from February 10, 2020, depending on the breakdown direction of a fairly narrow range :

- resistance level of 98.75 - lower boundary of the ISL38.2 equilibrium zone of the Minor operational scale forks;

- support level of 98.65 - the upper boundary of the 1/2 Median Line Minor channel.

The breakdown of ISL38.2 Minor - resistance level of 98.75 - will make the development of #USDX movement in the equilibrium zone (98.75 - 99.40 - 100.00) of the Minor operational scale forks relevant.

The breakdown of support level 98.65 - the development of the dollar index movement will continue within the 1/2 Median Line channel (98.65 - 98.25 - 97.85)of the Minor operational scale forks and the equilibrium zone (98.20 - 97.95 - 97.65) of the Minuette operational scale forks.

The markup of #USDX movement options from February 10, 2020 is shown on the animated chart.

This image is no longer relevant

____________________

Euro vs US dollar

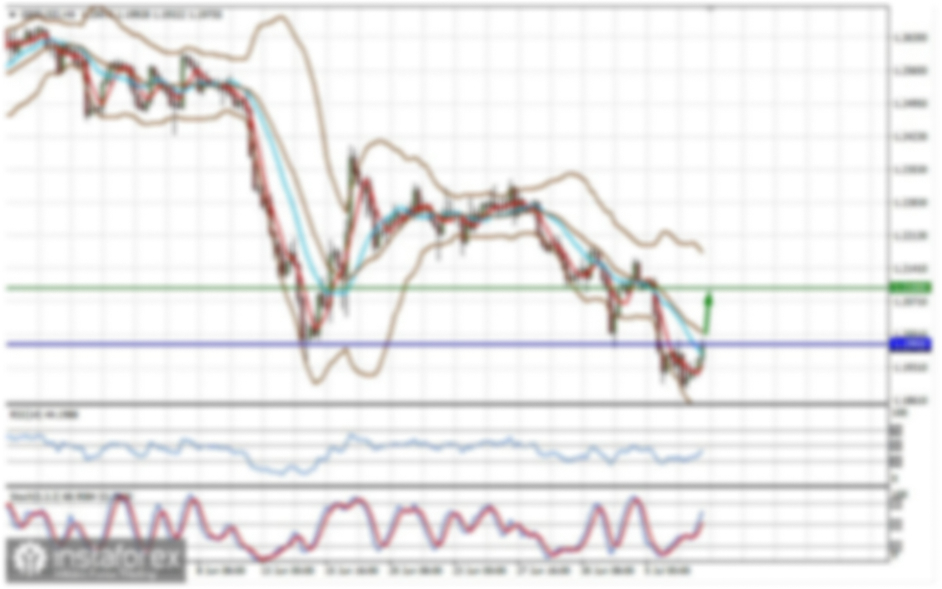
The development of the single European currency EUR/USD from February 10, 2020 will be determined by the development and direction of the breakdown of the channel boundaries 1/2 Median Line (1.0900 - 1.0950 - 1.1000) of the Minor operational scale forks. We look at the animated chart for the details.

The breakdown of the support level of 1.0900 on the lower boundary of the 1/2 Median Line Minor channel and the update of minimum 1.0879 will confirm the continuation of the downward movement of the single European currency to the warning line LWL38.2 (1.0755) of the Minor operational scale forks.

On the other hand, in case of breakdown of the resistance level of 1.1000 (upper boundary of the 1/2 Median Line Minor channel), the development of the EUR / USD movement will continue in the equilibrium zone (1.1000 - 1.1035 - 1.1070) of the Minuette operational scale forks with the prospect of reaching the boundaries of the 1/2 Median Line Minuette channel (1.1130 - 1.1155 - 1.1188).

The details of the EUR / USD movement options from February 10, 2020 are shown on the animated chart.

This image is no longer relevant

____________________

Great Britain pound vs US dollar

The development of Her Majesty's GBP/USD currency movement from February 10, 2020 will continue depending on the breakdown direction of the range :

  • resistance level 1of .2965 (the upper boundary of the 1/2 Median Line channel of the Minuette operational scale forks);
  • support level of 1.2870 (the lower boundary of the 1/2 Median Line Minor channel).

In case of breakdown of the lower boundary of the 1/2 Median Line channel (1.2870) of the Minor operational scale forks, the downward movement of Her Majesty's currency can continue to 1/2 of the Median Line Minuette (1.2790), and in case of breakdown it will become possible to reach GBP / USD boundaries of the equilibrium zone (1.2645 - 1.2420 - 1.2200) of the Minuette operational scale forks.

On the contrary, in case of breakdown of the upper boundary of the 1/2 Median Line Minuette channel (1.2965), the development of GBP / USD movement in the 1/2 Median Line channel (1.2870 - 1.3150 - 1.3435) of the Minor operational scale forks will be confirmed.

The details of the GBP / USD movement options from February 10, 2020 are shown on the animated chart.

This image is no longer relevant

____________________

US dollar vs Japanese yen

The development of the currency movement of the "country of the rising sun" USD / JPY and from February 10, 2020 will be determined by the development and the direction of the breakdown of the range :

  • resistance level of 109.90 (start line SSL of the Minuette operational scale forks);
  • support level of 109.05 (reaction line RL38.2 Minuette).

The breakdown of the initial SSL Minuette line - resistance level of 109.90 - will lead to the continuation of the development of the upward movement of USD / JPY to the control line UTL (110.50) of the Minuette operational scale forks with the prospect of reaching the boundaries of the equilibrium zone (111.65 - 113.00 - 114.20) of the Minor operational scale forks.

Successive breakdown of support levels :

- 108.50 - reaction line RL38.2 Minute;

- 109.55 - the upper boundary of the 1/2 Median Line Minor channel;

will make it possible for the currency of the "land of the rising sun" to continue to develop in the 1/2 Median Line channel (108.70 - 107.75 - 106.90) of the Minor operational scale forks with the prospect of reaching the upper boundary of ISL38.2 (106.40) equilibrium zone fof the Minuette operational scale forks.

We look at the details of the USD / JPY movement options from February 10, 2020 on the animated chart.

This image is no longer relevant

____________________

The review was compiled without taking into account the news background. Thus, the opening trading sessions of major financial centers does not serve as a guide to action (placing orders "sell" or "buy").

The formula for calculating the dollar index :

USDX = 50.14348112 * USDEUR0.576 * USDJPY0.136 * USDGBP0.119 * USDCAD0.091 * USDSEK0.042 * USDCHF0.036.

where power factors correspond to the weights of the currencies in the basket:

Euro - 57.6% ;

Yen - 13.6% ;

Pound Sterling - 11.9% ;

Canadian dollar - 9.1%;

Swedish krona - 4.2%;

Swiss franc - 3.6%.

The first coefficient in the formula leads the index to 100 at the starting date - March 1973, when the main currencies began to be freely quoted relative to each other.

Ratu Taslim,
ผู้เชี่ยวชาญด้านการวิเคราะห์ของ InstaForex
© 2007-2025
เลือกช่วงเวลา
5
นาที
15
นาที
30
นาที
1
ชั่วโมง
4
ชั่วโมง
1
วัน
1
สัปดาห์
รับผลกำไรจากการเปลี่ยนแปลงอัตราสกุลเงินดิจิทัลกับ InstaForex.
ดาวน์โหลด MetaTrader 4 และเปิดการซื้อขายครั้งแรกของคุณ.
  • Grand Choice
    Contest by
    InstaForex
    InstaForex always strives to help you
    fulfill your biggest dreams.
    เข้าร่วมการแข่งขัน


บทความแนะนำ

การคาดการณ์สำหรับ EUR/USD ในวันที่ 25 มิถุนายน 2025

เมื่อวันอังคาร คู่เงิน EUR/USD ยังคงมีการเคลื่อนไหวในทิศทางขาขึ้นและใกล้จะถึงระดับ 1.1645 การดีดตัวจากระดับนี้จะเป็นประโยชน์ต่อดอลลาร์สหรัฐและนำไปสู่การลดลงสู่ระดับ Fibonacci ที่ 100.0% ที่ 1.1574 การปิดตัวอย่างมั่นคงเหนือ 1.1645 จะเพิ่มความน่าจะเป็นของการเติบโตต่อไปสู่ระดับการแก้ไขถัดไปที่ 127.2%

Samir Klishi 12:49 2025-06-25 UTC+2

การคาดการณ์สำหรับ GBP/USD ในวันที่ 25 มิถุนายน 2025

ในกราฟรายชั่วโมง คู่สกุลเงิน GBP/USD ยังคงเคลื่อนไหวขึ้นในวันอังคารไปยังเขตแนวต้านที่ 1.3611–1.3633 ซึ่งเป็นความพยายามครั้งที่ห้าของกลุ่มตลาดกระทิงที่จะยึดเกาะเหนือพื้นที่นี้ การปิดตลาดเหนือระดับนี้จะเป็นการเปิดโอกาสให้คาดการณ์ถึงการเติบโตต่อเนื่องไปยังระดับการแก้ไข Fibonacci ถัดไปที่ 200.0% ที่ 1.3749 การเด้งกลับจะเอื้อต่อดอลลาร์สหรัฐอเมริกาและการลดลงไปยังระดับ Fibonacci 127.2%

Samir Klishi 12:46 2025-06-25 UTC+2

การพยากรณ์อัตราแลกเปลี่ยน วันที่ 25/06/2025: EUR/USD, USD/JPY, SP500, NDX, INDU และ Bitcoin

ลิงก์ที่มีประโยชน์: บทความอื่น ๆ ของฉันสามารถอ่านได้ในหมวดนี้ หลักสูตร InstaForex สำหรับผู้เริ่มต้น การวิเคราะห์ยอดนิยม เปิดบัญชีซื้อขาย สำคัญ: ผู้เริ่มต้นในการซื้อขายฟอเร็กซ์จำเป็นต้องระมัดระวังอย่างมากเมื่อทำการตัดสินใจเกี่ยวกับการเข้าสู่ตลาด ก่อนที่จะมีการประกาศรายงานสำคัญ ควรหลีกเลี่ยงการอยู่ในตลาดเพื่อป้องกันความเสี่ยงจากความผันผวนของตลาดที่เพิ่มขึ้น หากคุณตัดสินใจที่จะซื้อขายในช่วงที่มีการประกาศข่าว ควรตั้งคำสั่งหยุดเพื่อทำให้การขาดทุนน้อยลง

Sebastian Seliga 10:03 2025-06-25 UTC+2

EUR/USD ยังคงพยายามทดสอบแนวต้านแรก วันพุธที่ 25 มิถุนายน 2025

คู่เงิน EUR/USD เคลื่อนไหวในช่วงระดับระหว่างจุดหมุนที่ 1 และเขตแนวต้าน ด้วยแนวโน้มขาขึ้น. ระดับสำคัญ 1. แนวต้าน 2: 1.16753. 2. แนวต้าน 1: 1.16419

Arief Makmur 09:13 2025-06-25 UTC+2

การแข็งค่าของ USD/JPY ที่เกิดขึ้นเป็นเพียงการปรับตัวชั่วคราวเท่านั้น วันพุธที่ 25 มิถุนายน 2025

แม้ว่าจะมีความเป็นไปได้ในการแก้ไขการแข็งค่า แต่ USD/JPY ยังคงมีโอกาสอ่อนค่าลงอีกครั้งตามแนวโน้มเดิม ระดับสำคัญ 1. แนวต้านที่ 2 : 145.839 2. แนวต้านที่ 1 : 145.378

Arief Makmur 09:13 2025-06-25 UTC+2

การคาดการณ์ EUR/USD สำหรับวันที่ 25 มิถุนายน 2025

ค่าเงินยูโรยังคงเคลื่อนไหวไปสู่เป้าหมายที่ตั้งไว้ที่ 1.1820 ซึ่งเป็นขอบเขตบนของช่องราคา การเติบโตเมื่อวานนี้รวมทั้งหมด 32 จุด ตลาดขาลงสามารถเปลี่ยนแนวโน้มได้ต่อเมื่อราคาคงที่ต่ำกว่าระดับ 1.1535 ซึ่งจะหมายถึงการพุ่งต่ำกว่าค่าเฉลี่ย MACD เส้นออสซิลเลเตอร์ Marlin กำลังเพิ่มขึ้นอย่างมั่นใจ วันนี้มีการประกาศข้อมูลยอดขายบ้านของสหรัฐฯ ในเดือนพฤษภาคม

Laurie Bailey 05:12 2025-06-25 UTC+2

การคาดการณ์ GBP/USD สำหรับวันที่ 25 มิถุนายน 2025

เงินปอนด์อังกฤษได้ถึงระดับเป้าหมายที่ 1.3635 แล้ว ซึ่ง ณ เช้าวันนี้กำลังเตรียมตัวที่จะผ่านจุดสูงสุดของเมื่อวานเพื่อที่จะเดินหน้าขึ้นไปสู่เป้าหมายถัดไปที่ระดับสูงสุดในเดือนตุลาคม 2021 ที่ 1.3834 เส้นราคาช่องด้านในตั้งแต่เดือนมกราคมปีนี้อยู่ใกล้กับระดับนี้ ราคายังเคลื่อนที่เหนือเส้น MACD และออสซิลเลเตอร์ Marlin ได้เข้าตั้งถิ่นฐานอยู่ในโซนบวก

Laurie Bailey 05:12 2025-06-25 UTC+2

การคาดการณ์ราคาน้ำมันสำหรับวันที่ 25 มิถุนายน 2025

หลังจากลดลงอย่างมากเป็นเวลาสองวัน ราคาน้ำมันได้มาถึงระดับเป้าหมายที่ 64.00 ซึ่งเคยเป็นแนวรับที่แข็งแกร่งในเดือนมีนาคมและเมษายน 2023 และเคยทำหน้าที่เป็นแนวต้านในเดือนพฤษภาคมปีนี้ การลดลงหยุดชั่วคราวที่เส้นตัวบ่งชี้สมดุล และมีการกลับตัวขึ้นของออสซิลเลเตอร์ Marlin ในกราฟรายวัน เป็นไปได้ที่จะมีการปรับตัวลงไปในช่วง 66.34–67.18 ซึ่งเคยทำหน้าที่เป็นแนวรับที่ยาวนานตั้งแต่เดือนตุลาคมถึงธันวาคม 2024 จากนั้นเราคาดว่าการเคลื่อนไหวในแนวโน้มขาลงจะยังคงดำเนินต่อไป

Laurie Bailey 05:12 2025-06-25 UTC+2

XAU/USD. การวิเคราะห์และพยากรณ์ สถานการณ์ตลาดปัจจุบัน

จากมุมมองทางเทคนิค ราคาทองคำในกราฟ 4 ชั่วโมงได้ปรากฏการยอมรับต่ำกว่าเส้นค่าเฉลี่ยเคลื่อนที่อย่างง่าย (SMA) 100 ช่วง ซึ่งเป็นสัญญาณที่บ่งบอกถึงความเป็นไปได้ที่จะมีการลดลงต่อเนื่อง นอกจากนี้ ออสซิลเลเตอร์ในกราฟเดียวกันยังแสดงทิศทางลบ แม้ว่าจะอยู่ในระดับขายมากเกินไป ซึ่งบ่งชี้ถึงการฟื้นตัวได้ระหว่างวัน การกดดันขายที่ต่ำกว่าระดับแนวรับที่ $3325 จะยืนยันความเป็นไปได้ที่จะดิ่งลงต่อ

Irina Yanina 18:27 2025-06-24 UTC+2

สัญญาณการเทรดสำหรับทองคำ (XAU/USD) ระหว่างวันที่ 24-28 มิถุนายน 2025: ขายต่ำกว่า $3,327 (21 SMA - 200 EMA)

ในช่วงต้นของการซื้อขายในตลาดสหรัฐฯ ทองคำอยู่ที่ประมาณ 3,300 ซึ่งต่ำกว่าค่าเฉลี่ยเคลื่อนที่อย่างง่าย 21 วัน และต่ำกว่าค่าเฉลี่ยเคลื่อนที่เอ็กซ์โปเนนเชียล 200 วัน เราเห็นการปรับฐานทางเทคนิคที่แข็งแกร่งลงมาต่ำกว่า 3,390 ในช่วงไม่กี่ชั่วโมงที่ผ่านมา และการฟื้นตัวทางเทคนิคที่ระดับราคาปัจจุบันถือว่าเป็นไปได้ บริเวณ 3,300

Dimitrios Zappas 18:05 2025-06-24 UTC+2
หากไม่สะดวกคุยในตอนนี้
ระบุคำถามไว้ได้ใน แชท.
Widget callback
 

Dear visitor,

Your IP address shows that you are currently located in the USA. If you are a resident of the United States, you are prohibited from using the services of InstaFintech Group including online trading, online transfers, deposit/withdrawal of funds, etc.

If you think you are seeing this message by mistake and your location is not the US, kindly proceed to the website. Otherwise, you must leave the website in order to comply with government restrictions.

Why does your IP address show your location as the USA?

  • - you are using a VPN provided by a hosting company based in the United States;
  • - your IP does not have proper WHOIS records;
  • - an error occurred in the WHOIS geolocation database.

Please confirm whether you are a US resident or not by clicking the relevant button below. If you choose the wrong option, being a US resident, you will not be able to open an account with InstaForex anyway.

We are sorry for any inconvenience caused by this message.