empty
14.07.2020 06:32 PM
Comprehensive analysis of movement options for gold, palladium, platinum, and silver (H4) on July 15, 2020

Minute operational scale (H4)

Second half of July - overview of the movement options for the main precious metals gold, palladium, platinum, and silver on July 15, 2020.
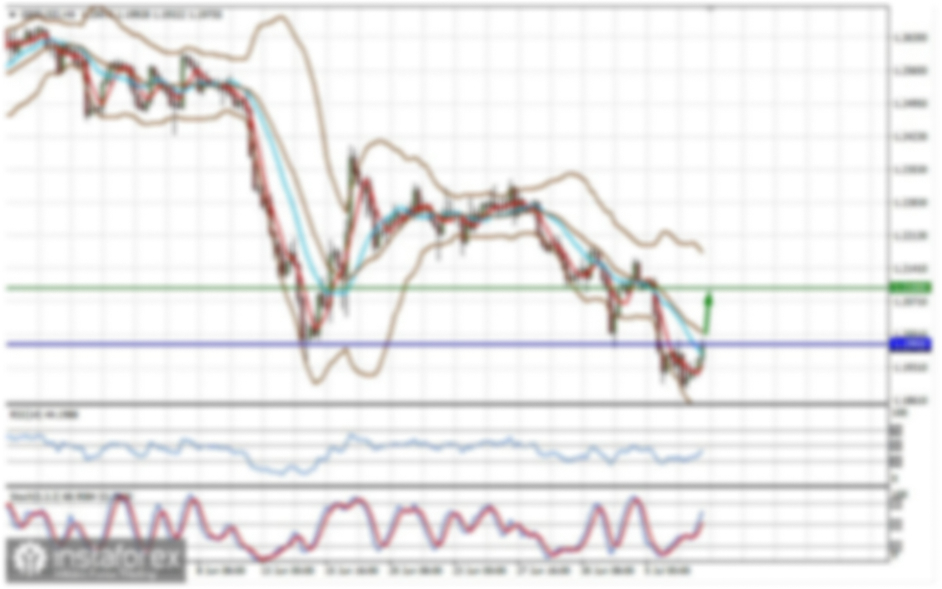
____________________

Spot Gold

The development of the Spot Gold movement from July 15, 2020 will be determined by the development and direction of the breakdown of the range:

  • resistance level of 1800.00 - the reaction line RL23.6 of the Minuette operational scale forks;
  • support level of 1785.00 - the UWL38.2 warning line of the Minute operational scale forks.

If the warning line UWL38.2 of the Minute operational scale forks is broken, the support level of 1785.00 will determine the Spot Gold movement to the borders of the 1/2 Median Line channel (1780.00 - 1767.00 - 1755.00) and the equilibrium zone (1750.00 - 1730.00 - 1710.00) of the Minuette operational scale.

In case of breakdown of the reaction line RL23.6 of the Minuette operational scale forks - resistance level of 1800.00 - the development of the movement of this instrument will continue towards:

  • starting line SSL Minuette (1813.00);
  • local maximum 1817.00;
  • control line UTL Minuette (1824.00);
  • with the prospect of reaching the price of the SSL initial line tool (1854.00) and the channel boundaries 1/2 Median Line (1861.00 - 1890.00 - 1919.00) of the Minute operational scale forks.

Details of the Spot Gold movement from July 15, 2020 can be seen on the animated chart.

This image is no longer relevant

____________________

#PAF (Palladium) Current Month

From July 15, 2020, the movement of #PAF (Palladium) will be determined by the development and direction of the breakdown of the range:

  • resistance level of 2022.00 - the lower border of the channel 1/2 Median Line of the Minute operational scale forks;
  • support level of 2000.00 - the upper border of the channel 1/2 Median Line of the Minuette operational scale forks.

With the breakdown of the support level of 2000.00, the development of the Palladium movement can continue within the boundaries of the 1/2 Median Line channel (2000.00 - 1970.00 - 1941.00) and the equilibrium zone (1960.00 - 1918.00 - 1878.00) of the Minuette operational scale forks.

In case of breakdown of the resistance level at 2022.00, #PAF movement will begin to flow within the 1/2 Median Line channel (2022.00 - 2071.00 - 2121.00) of the Minute operational scale forks, taking into account the development of the initial - SSL (2080.00) and control - UTL (2093.00) lines of the Minuette operational scale forks.

The markup of #PAF (Palladium) motion options from July 15, 2020 is shown on the animated chart.

This image is no longer relevant

____________________

#PLF (Platinum) Current Month

The development of the #PLF (Platinum) movement from July 15, 2020 will be determined by the development and direction of the breakdown of the boundaries of the equilibrium zone (838.0 - 823.0 - 808.0) of the Minuette operational scale forks - details of the motion marking in this zone are shown in the animated graph.

In case of breakdown of the lower border of ISL61.8 of the Minuette operational scale forks - support level of 808.0 - the downward movement #PLF can be continued to the goals:

  • warning line LWL38.2 (800.0) of the Minute operational scale forks;
  • local minimum 790.5;
  • warning line LWL61.8 (772.0) of the Minute operational scale forks.

If the upper limit of the ISL38.2 zone of equilibrium of the Minuette operational scale forks is broken - resistance level of 838.0 - the Platinum movement will be directed to the initial SSL line (848.0) of the Minute operational scale forks scale and the channel boundaries 1/2 Median Line Minuette (855.0 - 865.0 - 875.0), with the prospect of reaching the SSL Minuette start line (881.0) and the 1/2 Median Line (887.0 - 911.0 - 935.0) of the Minute operational scale forks.

Details of #PLF (Platinum) motion options from June 15, 2020 are shown on the animated chart.

This image is no longer relevant

____________________

Spot Silver

The development of the Spot Silver movement from July 15, 2020 will also be determined by the development and direction of the breakdown of the range:

  • resistance level of 19.335 - initial line of SSL of the Minuette operational scale forks;
  • support level of 18.900 - reaction line RL23.6 of the Minuette operational scale forks.

Breakdown of the reaction line RL23. 6 forks operating scale Minuette-support level 18.900-a variant of the development of the movement of Spot Silver to the borders of the channel 1/2 Median Line (18.700 - 18.500 - 18.300) and equilibrium zones (18.300 - 18.000 - 17.670) a minuette operating scale fork.

Breakdown of the reaction line RL23.6 forks of the operational scale Minuette - support level 18.900 - option for the development of Spot Silver movement to the borders of the 1/2 Median Line channel (18.700 - 18.500 - 18.300) and the equilibrium zone (18.300 - 18.000 - 17.670) of the Minuette operational scale forks.

Details of the Spot Silver movement options from July 15, 2020 are shown in the animated chart.

This image is no longer relevant

____________________

The review is compiled without taking into account the news background, the opening of trading sessions of the main financial centers and is not a guide to action (placing "sell" or "buy" orders).

Ratu Taslim,
ผู้เชี่ยวชาญด้านการวิเคราะห์ของ InstaForex
© 2007-2025
เลือกช่วงเวลา
5
นาที
15
นาที
30
นาที
1
ชั่วโมง
4
ชั่วโมง
1
วัน
1
สัปดาห์
รับผลกำไรจากการเปลี่ยนแปลงอัตราสกุลเงินดิจิทัลกับ InstaForex.
ดาวน์โหลด MetaTrader 4 และเปิดการซื้อขายครั้งแรกของคุณ.
USD/JPY: เคล็ดลับการซื้อขายง่าย ๆ สำหรับนักเทรดมือใหม่วันที่ 23 มิถุนายน (ช่วงการซื้อขายสหรัฐฯ) การวิเคราะห์การซื้อขายและเคล็ดลับสำหรับการซื้อขายเงินเยนญี่ปุ่น การทดสอบระดับ 147.48 เกิดขึ้นเมื่ออินดิเคเตอร์ MACD อยู่ในโซนที่มีการซื้อเกิน ซึ่งส่งผลให้แผนการณ์ที่ 1 สำหรับการซื้อดอลลาร์ไม่สามารถเล่นได้ในระหว่างแนวโน้มขาขึ้นที่กำลังดำเนินอยู่ ฉันพลาดจุดเข้าซื้อและจบลงด้วยการไม่มีการซื้อขาย การขายในครั้งที่สองที่ทดสอบระดับ 147.48 ส่งผลให้เกิดการขาดทุน เป็นที่ทราบกันว่าอิหร่านได้โจมตีด้วยปืนครกที่ฐานทัพทหารของสหรัฐในจังหวัดฮาซากะทางภาคตะวันออกเฉียงเหนือของซีเรีย ทำให้สถานการณ์ในตะวันออกกลางยิ่งตึงเครียดและกระตุ้นการซื้อดอลลาร์ใหม่
  • Grand Choice
    Contest by
    InstaForex
    InstaForex always strives to help you
    fulfill your biggest dreams.
    เข้าร่วมการแข่งขัน


บทความแนะนำ

USD/JPY. การวิเคราะห์และพยากรณ์สถานการณ์ตลาดปัจจุบัน

จากมุมมองทางเทคนิค เมื่อกระทิงสามารถผ่านด่านด่านกับ 100-day Simple Moving Average (SMA) รอบระดับ 146.80 จะยังคงครอบงำตลาด การซื้อที่เกินระดับจิตวิทยา 147.00 ยืนยันมุมมองเชิงบวกที่เด่นชัด ดันราคา spot

Irina Yanina 17:53 2025-06-23 UTC+2

สัญญาณการซื้อขายสำหรับ EUR/USD ระหว่างวันที่ 23-28 มิถุนายน 2025: ซื้อเหนือ 1.1460 (21 SMA - 6/8 Murray)

ในทางตรงกันข้าม พื้นที่นี้รอบๆ 21SMA ซึ่งตั้งอยู่ที่ระดับจิตวิทยา 1.15 ถือว่าเป็นกุญแจสำคัญ ถ้าราคาลดลงต่ำกว่าพื้นที่นี้ เราอาจคาดการณ์ว่าจะเกิดการทะลุออกของแนวโน้มขาขึ้นอย่างรวดเร็วและยูโรอาจลดลงไปสู่อัตรา 4/8 Murray ที่ตั้งอยู่ที่ 1.1230 ทั้งนี้ เรายังคาดหวังว่าจะเติมช่องว่างที่เคยเกิดขึ้นที่ 1.1180

Dimitrios Zappas 16:34 2025-06-23 UTC+2

สัญญาณการซื้อขายสำหรับทองคำ (XAU/USD) ระหว่างวันที่ 23-28 มิถุนายน 2025: ซื้อเมื่อราคาสูงกว่า $3,350 (21 SMA - 7/8 Murray)

หากราคาทองคำยังคงฟื้นตัวและตั้งตัวอยู่เหนือเส้นค่าเฉลี่ย 21 วันที่ 3,364 นี่อาจเป็นโอกาสในการซื้อ โดยมีเป้าหมายที่ 8/8 มัลเรย์ ที่ 3,437 สุดท้ายแล้วโลหะนี้อาจไปถึง +1/8 มัลเรย์ ที่ประมาณ 3,515

Dimitrios Zappas 16:23 2025-06-23 UTC+2

การพยากรณ์อัตราแลกเปลี่ยนเงินตรา 23/06/2025: EUR/USD, GBP/USD, USDX, น้ำมัน, Ethereum และ Bitcoin

ลิงก์ที่เป็นประโยชน์: บทความอื่นๆ ของฉันสามารถอ่านได้ในส่วนนี้ หลักสูตร InstaForex สำหรับมือใหม่ ข้อมูลวิเคราะห์ยอดนิยม เปิดบัญชีซื้อขาย สำคัญ: ผู้เริ่มต้นในตลาดฟอร์เร็กซ์ควรระมัดระวังเป็นพิเศษเมื่อทำการตัดสินใจเกี่ยวกับการเข้าสู่ตลาด ก่อนการเผยแพร่รายงานที่สำคัญ ควรหลีกเลี่ยงการเข้าตลาดเพื่อป้องกันไม่ให้ถูกผลกระทบจากความผันผวนที่เพิ่มขึ้น หากตัดสินใจที่จะเทรดในช่วงการเผยแพร่ข่าว ควรวางคำสั่งหยุดขาดทุน (stop

Sebastian Seliga 12:08 2025-06-23 UTC+2

การวิเคราะห์ทางเทคนิคสำหรับสัปดาห์ที่ 23–28 มิถุนายน: คู่สกุลเงิน GBP/USD

ในสัปดาห์นี้ จากระดับราคา 1.3446 (ราคาปิดของแท่งเทียนรายสัปดาห์ที่ผ่านมา) ราคามีแนวโน้มที่จะลดลงต่อเนื่องสู่เป้าหมายที่ 1.3256 ซึ่งเป็นระดับการดึงกลับที่ 23.6% (เส้นประสีแดง) เมื่อทดสอบระดับนี้แล้ว ราคามีโอกาสเคลื่อนไหวขึ้นสู่ 13 EMA ที่ระดับ 1.3317

Stefan Doll 11:38 2025-06-23 UTC+2

การวิเคราะห์ทางเทคนิคสำหรับสัปดาห์ที่ 23–28 มิถุนายน: คู่สกุลเงิน EUR/USD

สัปดาห์นี้ จากระดับ 1.1520 (ปิดของเทียนรายสัปดาห์ล่าสุด) ตลาดอาจเริ่มเคลื่อนไหวลงไปสู่เป้าหมายที่ 1.1418 ซึ่งเป็นระดับหยุดพัก 14.6% (เส้นประสีน้ำเงิน) เมื่อลองทดสอบระดับนี้แล้ว ราคามีแนวโน้มที่จะดีดตัวขึ้นไปสู่ระดับหยุดพัก 76.4% ที่ 1.1452 (เส้นประสีแดง)

Stefan Doll 11:31 2025-06-23 UTC+2

การคาดการณ์สำหรับ EUR/USD ในวันที่ 23 มิถุนายน 2025

ในวันศุกร์ คู่เงิน EUR/USD ยังคงปรับตัวขึ้นหลังจากดีดตัวจากระดับการแก้ไข 76.4% ที่ 1.1454 อย่างไรก็ตาม ในคืนวันจันทร์ คู่เงินกลับมาที่ระดับนี้อีกครั้ง การดีดตัวใหม่ช่วยให้นักวิเคราะห์คาดหวังการเติบโตใหม่ของเงินยูโรไปยังระดับการแก้ไข 100.0% ที่ 1.1574 การที่อัตราของคู่เงินหากสามารถยืนอยู่ต่ำกว่า

Samir Klishi 11:24 2025-06-23 UTC+2

พยากรณ์สำหรับ GBP/USD ในวันที่ 23 มิถุนายน 2025

ในกราฟรายชั่วโมง คู่เงิน GBP/USD ในวันศุกร์ได้มีการรวมตัวต่ำกว่าพื้นที่สนับสนุนที่ 1.3425–1.3444 อีกครั้ง ซึ่งทำให้สามารถคาดหวังถึงการลดลงอย่างต่อเนื่องไปยังระดับสนับสนุนที่ 1.3357–1.3373 การดีดตัวจากโซนนี้หรือปิดเหนือระดับ 1.3425–1.3444 จะเป็นประโยชน์ต่อเงินปอนด์อังกฤษและการกลับมาเติบโตสู่ระดับ 127.2% Fibonacci ที่ 1.3527

Samir Klishi 11:19 2025-06-23 UTC+2

การวิเคราะห์ทางเทคนิคของการเคลื่อนไหวรายวันของคู่สกุลเงินแปลกใหม่ USD/IDR, วันจันทร์ที่ 23 มิถุนายน 2025

16473.27 ขณะนี้ในกราฟรายวัน คู่สกุลเงินหายาก USD/IDR มีรูปแบบ Bullish 123 ซึ่งบ่งชี้ว่า USD/IDR กำลังแข็งค่าขึ้น ซึ่งได้รับการยืนยันจากการเคลื่อนไหวของราคาของคู่สกุลเงินหายากนี้เหนือ WMA (21) ซึ่งยังลาดขึ้น ดังนั้นตราบใดที่ยังไม่มีการอ่อนค่าลงอีกที่จะทะลุและปิดต่ำกว่าระดับ

Arief Makmur 07:29 2025-06-23 UTC+2

การวิเคราะห์ทางเทคนิคของการเคลื่อนไหวของราคาน้ำมันดิบรายวัน จันทร์ที่ 23 มิถุนายน 2025

นอกเหนือจากการปรากฏขึ้นของ Divergence ระหว่างการเคลื่อนที่ของราคาน้ำมันดิบและอินดิเคเตอร์ Stochastic Oscillator บนกราฟ 4 ชั่วโมงแล้ว ยังมีรูปแบบ Bearish 123 และกราฟ Triangle ที่แสดงให้เห็นว่าในอนาคตอันใกล้นี้ #CL

Arief Makmur 07:29 2025-06-23 UTC+2
หากไม่สะดวกคุยในตอนนี้
ระบุคำถามไว้ได้ใน แชท.
Widget callback
 

Dear visitor,

Your IP address shows that you are currently located in the USA. If you are a resident of the United States, you are prohibited from using the services of InstaFintech Group including online trading, online transfers, deposit/withdrawal of funds, etc.

If you think you are seeing this message by mistake and your location is not the US, kindly proceed to the website. Otherwise, you must leave the website in order to comply with government restrictions.

Why does your IP address show your location as the USA?

  • - you are using a VPN provided by a hosting company based in the United States;
  • - your IP does not have proper WHOIS records;
  • - an error occurred in the WHOIS geolocation database.

Please confirm whether you are a US resident or not by clicking the relevant button below. If you choose the wrong option, being a US resident, you will not be able to open an account with InstaForex anyway.

We are sorry for any inconvenience caused by this message.