empty
13.11.2023 12:31 PM
Weekly forecast based on simplified wave analysis: GBP/USD, AUD/USD, USD/CHF, EUR/JPY, AUD/JPY, and US dollar index from November 13th

GBP/USD

Brief Analysis:

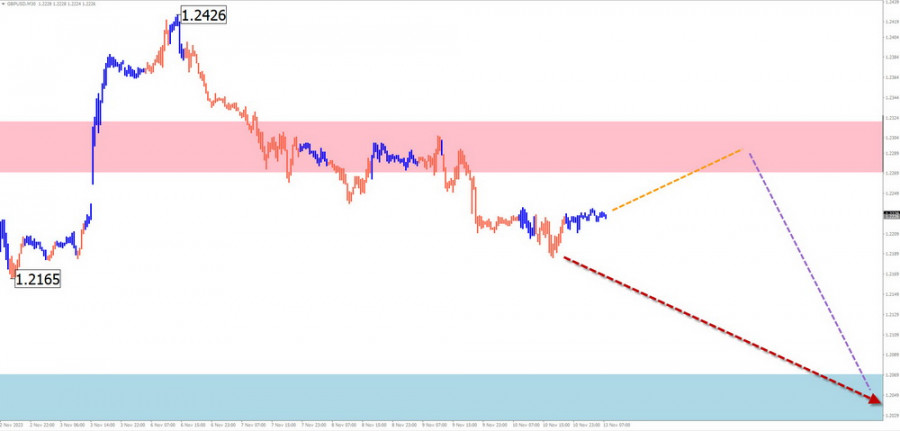
The short-term trend of the British pound has been determined by a bearish wave since mid-summer. The structure initiated the intermediate part (B) on October 4. The downward segment from November 6 has a reversal potential. Quotes are within the potential reversal zone on a weekly scale. Before continuing the trend, the price needs to be corrected.

Weekly Forecast:

The beginning of the upcoming week is expected to be flat. Price movements of the pound are likely to be in a sideways range along the resistance zone. Subsequently, a downward vector can be expected. The calculated support is located at the accumulation of potential reversal zones of different scales.

This image is no longer relevant

Potential Reversal Zones:

Resistance:

  • 1.2270/1.2320

Support:

  • 1.2070/1.2020

Recommendations:

Sales: Possible with a fractional lot in separate sessions after signals from your trading system near the resistance zone appear.

Purchases: Not recommended until the completion of the upcoming correction.

AUD/USD

Brief Analysis:

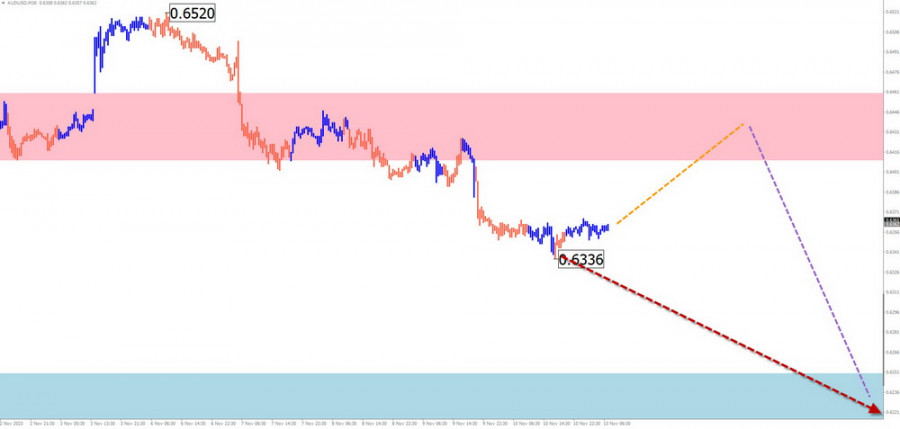
Within the dominant bearish trend, the quotes of the Australian dollar have been forming a corrective segment since October. Its magnitude does not exceed the correction level of the last part of the main wave. The downward segment from November 6 has a reversal potential. Upon confirmation, it will begin a new part of the main trend.

Weekly Forecast:

A sideways price vector is probable at the beginning of the upcoming week. Short-term growth is possible within the calculated support boundaries. Increased volatility and a resumption of downward price movement can be expected closer to the weekend. The support level demonstrates the lower boundary of the expected weekly range.

This image is no longer relevant

Potential Reversal Zones:

Resistance:

  • 0.6410/0.6460

Support:

  • 0.6250/0.6200

Recommendations:

Purchases: Risky. Due to the limited upward potential, there is a high probability of deposit loss.

Sales: This will become relevant after the appearance of corresponding signals in your used trading systems near the resistance zone.

USD/CHF

Brief Analysis:

The analysis of the daily chart of the Swiss Franc shows the formation of a downward wave since November. Since July 14, the price has been correcting upward towards the main movement. The structure of this wave needs to be completed. The nearest target is the preliminary target zone, the upper limit indicated by the level of calculated support.

Weekly Forecast:

The pair's price is expected to decline throughout the current week, reaching the support zone. At the beginning of the week, a short-term price rollback upward to the resistance zone is not ruled out. The greatest activity can be expected in the second half of the week.

This image is no longer relevant

Potential Reversal Zones:

Resistance:

  • 0.9080/0.9130

Support:

  • 0.8790/0.8740

Recommendations:

Purchases: Not relevant in the coming days.

Sales: This can be used for trading after the appearance of confirmed signals in the resistance zone.

EUR/JPY

Brief Analysis:

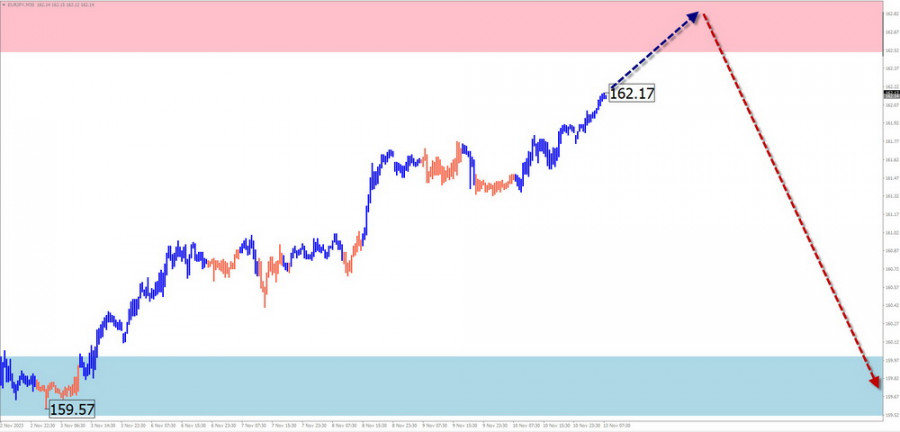
The unfinished wave structure of the euro against the Japanese yen's chart is directed upward and has been counting since July 28. Since the beginning of last month, the price has been forming the final part of the wave (C). The wave structure needs to look complete. Quotes are approaching the upper limit of the potential reversal zone on a weekly timeframe.

Weekly Forecast:

In the next couple of days, one can expect the continuation of the pair's price increase. A breakthrough beyond the resistance zone is unlikely. Towards the end of the week, against the backdrop of increased volatility, a change in direction and a resumption of price decline are expected. The calculated support indicates the lower boundary of the expected weekly range.

This image is no longer relevant

Potential Reversal Zones:

Resistance:

  • 162.50/163.00

Support:

  • 160.00/159.50

Recommendations:

Sales: Will become relevant after the appearance of reversal signals in your trading systems in the resistance zone.

Purchases: Can be used with a fractional lot in separate trading sessions.

AUD/JPY

Brief Analysis:

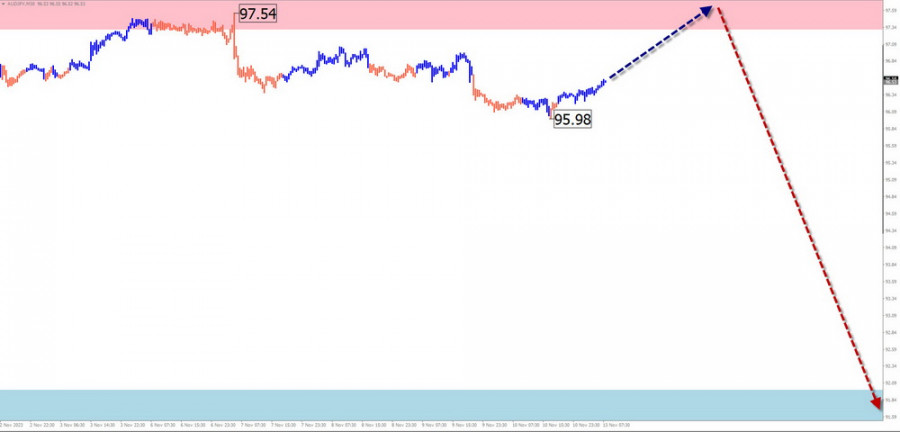
A flat price movement has been observed in recent months on the chart of the Australian Dollar against the Japanese yen. The unfinished wave structure has been downward since June 16. In its structure, the intermediate part (B) is approaching completion. The price is at the lower boundary of a strong resistance. There are no signals of an imminent reversal on the chart.

Weekly Forecast:

In the next few days, the most likely scenario will be an attempt to exert pressure on the resistance zone. Subsequently, one can expect a change in direction and the course of the cross towards the calculated support.

This image is no longer relevant

Potential Reversal Zones:

Resistance:

  • 97.30/97.80

Support:

  • 92.00/91.50

Recommendations:

Sales: This will become relevant after confirmed reversal signals appear in the resistance zone.

Purchases: The potential is limited by resistance. Transactions may become unprofitable.

US Dollar Index

Brief Analysis:

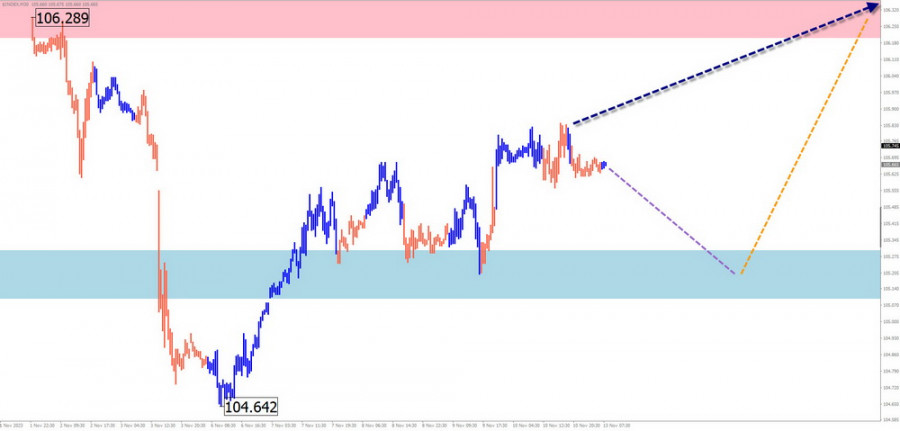
The quotes of the US Dollar have been regaining lost positions since mid-July. In the area of strong resistance, the price has been forming an upward correction since the beginning of October. Its structure looks completed at the time of the analysis. The upward segment from November 6 has a reversal potential. Upon confirmation, it will mark the beginning of the final part of the wave (C).

Weekly Forecast:

The index quotes may decline in the next few days, reaching the calculated support. After that, a sideways movement along its boundaries is expected to form a reversal and a rollback of upward index values. The limiting zone of the rise is the calculated resistance.

This image is no longer relevant

Potential Reversal Zones:

Resistance:

  • 106.20/106.40

Support:

  • 105.30/105.10

Recommendations:

Sales: Selling currencies in major pairs may be possible with a reduced lot in separate trading sessions.

Purchases: Purchases of national currencies will become relevant after the completion of the upcoming correction of the dollar index.

Note: In simplified wave analysis (SWA), all waves consist of 3 parts (A-B-C). The last unfinished wave is analyzed on each timeframe. Dashed lines indicate expected movements.

Attention: The wave algorithm does not consider the duration of instrument movements over time!

เลือกช่วงเวลา
5
นาที
15
นาที
30
นาที
1
ชั่วโมง
4
ชั่วโมง
1
วัน
1
สัปดาห์
รับผลกำไรจากการเปลี่ยนแปลงอัตราสกุลเงินดิจิทัลกับ InstaForex.
ดาวน์โหลด MetaTrader 4 และเปิดการซื้อขายครั้งแรกของคุณ.
USD/JPY: เคล็ดลับการซื้อขายง่ายๆ สำหรับนักเทรดมือใหม่ – 20 มิถุนายน (ช่วงเวลาในสหรัฐฯ) การรีวิวการเทรดและเคล็ดลับสำหรับการซื้อขายเงินเยนของญี่ปุ่น เนื่องจากความผันผวนต่ำ ระดับที่ฉันระบุไว้ไม่ได้รับการทดสอบในครึ่งแรกของวัน จากข้อมูลของดัชนีกิจกรรมการผลิตเฟดฟิลาเดลเฟีย ความต้องการของดอลลาร์สหรัฐไม่น่าจะลดลงอย่างมาก แม้ว่าตัวเลขจะอ่อนแอก็ตาม ซึ่งหมายความว่าผู้ซื้อมียุทธศาสตร์ทุกอย่างที่จำเป็นในการดำเนินโมเมนตัมขาขึ้นต่อในคู่ USD/JPY โดยเฉพาะเมื่อพิจารณาว่าเงินเยนไม่ได้มีความต้องการมากเท่าไรนักเมื่อเร็ว ๆ นี้ อย่างไรก็ตาม ถึงแม้ว่าจะมีการสนับสนุนทางเทคนิคและพื้นฐานที่ดีสำหรับการเพิ่มขึ้นต่อของ USD/JPY ความเสี่ยงที่อาจเกิดขึ้นก็ไม่ควรถูกมองข้าม
  • Grand Choice
    Contest by
    InstaForex
    InstaForex always strives to help you
    fulfill your biggest dreams.
    เข้าร่วมการแข่งขัน


บทความแนะนำ

การวิเคราะห์ GBP/USD ประจำวันที่ 17 มิถุนายน 2025

รูปแบบของกราฟ GBP/USD ยังคงบ่งชี้ถึงการก่อตัวของคลื่นแรงกระตุ้นขึ้น โครงสร้างของคลื่นคล้ายคลึงกับ EUR/USD เนื่องจากมีดอลลาร์สหรัฐเป็นตัวขับเคลื่อนหลัก ความต้องการดอลลาร์ลดลงในตลาดกว้าง ซึ่งส่งผลให้เกิดไดนามิกที่คล้ายคลึงกันในหลายเครื่องมือ คลื่น 2 ของช่วงแนวโน้มขาขึ้นมาในรูปของคลื่นเดี่ยว ในคลื่นที่คาดว่าเป็นคลื่น 3 คลื่น

Chin Zhao 21:24 2025-06-17 UTC+2

การวิเคราะห์ EUR/USD ณ วันที่ 17 มิถุนายน 2025

รูปแบบคลื่นในกราฟ EUR/USD 4 ชั่วโมงยังคงบ่งบอกถึงการพัฒนาของขาขึ้นของแนวโน้ม การเปลี่ยนแปลงนี้เกิดขึ้นเนื่องจากนโยบายการค้าของสหรัฐอเมริกาใหม่เท่านั้น จนกระทั่งถึงวันที่ 28 กุมภาพันธ์ ที่เริ่มต้นการลดลงของเงินดอลลาร์สหรัฐ รูปแบบคลื่นทั้งหมดดูเหมือนจะสร้างแนวโน้มขาลงที่น่าเชื่อถือ ขณะนั้นคลื่นแก้ไขตัวเลข 2 กำลังอยู่ในระหว่างการสร้าง อย่างไรก็ตาม การเริ่มต้นสงครามการค้าของ

Chin Zhao 21:18 2025-06-17 UTC+2

การวิเคราะห์ GBP/USD ในวันที่ 16 มิถุนายน 2525

รูปแบบคลื่นของ GBP/USD ยังคงแสดงถึงการพัฒนาของแนวโน้มขึ้นที่เป็นการกระตุ้น รูปแบบคลื่นก็เกือบจะเหมือนกับของ EUR/USD โดยสอดคล้องกับความเคลื่อนไหวของดอลลาร์สหรัฐ ความต้องการดอลลาร์สหรัฐลดลงในทั้งตลาด ซึ่งเป็นเหตุผลทำให้เครื่องมือที่หลายๆ อย่างแสดงความเคลื่อนไหวที่คล้ายคลึงกัน คลื่นที่ 2 ของแนวโน้มที่ขึ้นมีรูปแบบคลื่นเดียว ภายหลังคลื่นที่สมมุติว่าเป็นคลื่นที่ 3, คลื่นที่

Chin Zhao 19:48 2025-06-16 UTC+2

การวิเคราะห์ EUR/USD ประจำวันที่ 16 มิถุนายน 2025

รูปแบบคลื่นในกราฟ 4 ชั่วโมงของ EUR/USD ยังคงบ่งบอกถึงการพัฒนาของช่วงแนวโน้มขาขึ้น การเปลี่ยนแปลงนี้เกิดขึ้นอย่างสิ้นเชิงจากนโยบายการค้าที่ใหม่ของสหรัฐอเมริกา จนถึงวันที่ 28 กุมภาพันธ์ เมื่อการลดลงของดอลลาร์สหรัฐเริ่มขึ้น โครงสร้างคลื่นทั้งหมดดูเหมือนเป็นแนวโน้มขาลงที่ชัดเจน โดยสร้างคลื่นปรับตัวที่ 2 อย่างไรก็ดี สงครามการค้าที่ริเริ่มโดย

Chin Zhao 19:45 2025-06-16 UTC+2

การวิเคราะห์ EUR/USD ประจำวันที่ 11 มิถุนายน 2025

โครงสร้างของคลื่นในกราฟ 4 ชั่วโมงสำหรับคู่เงิน EUR/USD ได้เปลี่ยนเป็นการก่อตัวที่มีแนวโน้มเพิ่มขึ้นอย่างแข็งแกร่งและยังคงรักษารูปแบบนี้ไว้ ผมเชื่อว่าไม่มีข้อสงสัยว่านี่เป็นผลมาจากการเปลี่ยนแปลงนโยบายการค้าของสหรัฐฯ อย่างแน่นอน จนถึงวันที่ 28 กุมภาพันธ์ เมื่อค่าเงินดอลลาร์สหรัฐฯ เริ่มอ่อนค่าลงอย่างมาก โครงสร้างของคลื่นได้บ่งชี้ถึงแนวโน้มขาลงอย่างชัดเจน โดยคลื่นแก้ไขที่

Chin Zhao 19:00 2025-06-11 UTC+2

วิเคราะห์ GBP/USD วันที่ 11 มิถุนายน 2025

โครงสร้างคลื่นของ GBP/USD ยังคงบ่งบอกถึงการก่อตัวของรูปแบบคลื่นขาขึ้น รูปภาพของคลื่นนี้เกือบจะเหมือนกันกับคลื่นของ EUR/USD จนถึงวันที่ 28 กุมภาพันธ์ เราสังเกตเห็นการก่อตัวของโครงสร้างปรับฐานที่ชัดเจนซึ่งไม่มีข้อสงสัยใด ๆ อย่างไรก็ตาม ความต้องการในเงินดอลลาร์สหรัฐฯ เริ่มลดลงอย่างรวดเร็วในเวลาต่อมา ท้ายที่สุดนำไปสู่การกลับตัวของเทรนด์ คลื่น

Chin Zhao 18:51 2025-06-11 UTC+2

การวิเคราะห์ GBP/USD วันที่ 9 มิถุนายน 2025

สำหรับคู่สกุลเงิน GBP/USD รูปแบบคลื่นยังคงบ่งบอกถึงการก่อตัวของโครงสร้างคลื่นแรงกระตุ้นที่ขึ้นไปด้านบน รูปแบบคลื่นนี้คล้ายคลึงกับคู่สกุลเงิน EUR/USD จนถึงวันที่ 28 กุมภาพันธ์ เราได้เห็นโครงสร้างการแก้ไขที่น่าเชื่อถือที่ไม่มีข้อสงสัยใด ๆ เกิดขึ้น อย่างไรก็ตาม มีการลดลงของความต้องการในเงินดอลลาร์สหรัฐอย่างรวดเร็ว นำไปสู่การกลับทิศทางของแนวโน้มเป็นทิศทางขึ้น คลื่นที่

Chin Zhao 20:16 2025-06-09 UTC+2

วิเคราะห์ EUR/USD วันที่ 9 มิถุนายน 2025

โครงสร้างคลื่นบนกราฟ EUR/USD แบบ 4 ชั่วโมงได้เปลี่ยนไปเป็นรูปแบบขาขึ้นและยังคงรักษาโครงสร้างนี้อยู่ ฉันเชื่อว่ามีข้อสงสัยน้อยมากว่าการเปลี่ยนแปลงนี้เกิดขึ้นจากนโยบายการค้าของสหรัฐฯ รูปแบบคลื่นในตอนนี้แสดงให้เห็นถึงแนวโน้มขาลงที่ชัดเจนเกิดขึ้นช่วงวันที่ 28 กุมภาพันธ์เมื่อเงินดอลลาร์สหรัฐฯเริ่มลดลงอย่างรวดเร็ว มีการสร้างคลื่นแก้ไขที่ 2 ขึ้นมา อย่างไรก็ตาม การประกาศอัตราภาษีจาก Trump

Chin Zhao 20:09 2025-06-09 UTC+2

การวิเคราะห์ EUR/USD ประจำวันที่ 5 มิถุนายน 2025

รูปแบบคลื่นในกราฟ 4 ชั่วโมงของคู่สกุลเงิน EUR/USD ได้เปลี่ยนแปลงเป็นโครงสร้างที่เป็นขาขึ้นและยังคงรักษารูปแบบนี้เอาไว้ ฉันเชื่อว่ามีความสงสัยเล็กน้อยว่าการเปลี่ยนแปลงนี้เกิดขึ้นเนื่องจากนโยบายการค้าใหม่ของสหรัฐฯ เพียงอย่างเดียว จนถึงวันที่ 28 กุมภาพันธ์ เมื่อตอนที่ค่าเงินดอลลาร์สหรัฐเริ่มร่วงลงอย่างรวดเร็ว ทั้งรูปแบบคลื่นทั้งหมดก็ยังคงดูเหมือนแนวโน้มขาลงที่น่าเชื่อถือ โดยมีคลื่นปรับแก้ 2 กำลังก่อตัวขึ้น

Chin Zhao 20:03 2025-06-05 UTC+2

การวิเคราะห์ GBP/USD ณ วันที่ 4 มิถุนายน 2025

รูปแบบคลื่นสำหรับ GBP/USD ยังคงบ่งบอกถึงการก่อตัวของโครงสร้างคลื่นที่มีแรงผลักดันขึ้น รูปแบบคลื่นมีความเหมือนกับการระบายที่เกิดขึ้นกับคู่เงิน EUR/USD จนถึงวันที่ 28 กุมภาพันธ์ เราสังเกตเห็นการก่อตัวของโครงสร้างการแก้ไขที่มีความชัดเจน และไม่มีข้อสงสัยใดๆ อย่างไรก็ตาม หลังจากนั้น ความต้องการสำหรับสกุลเงินดอลลาร์สหรัฐเริ่มลดลงอย่างรวดเร็ว ส่งผลให้เกิดการกลับตัวของแนวโน้มเป็นขาขึ้น คลื่นลูกที่

Chin Zhao 18:48 2025-06-04 UTC+2
หากไม่สะดวกคุยในตอนนี้
ระบุคำถามไว้ได้ใน แชท.
Widget callback
 

Dear visitor,

Your IP address shows that you are currently located in the USA. If you are a resident of the United States, you are prohibited from using the services of InstaFintech Group including online trading, online transfers, deposit/withdrawal of funds, etc.

If you think you are seeing this message by mistake and your location is not the US, kindly proceed to the website. Otherwise, you must leave the website in order to comply with government restrictions.

Why does your IP address show your location as the USA?

  • - you are using a VPN provided by a hosting company based in the United States;
  • - your IP does not have proper WHOIS records;
  • - an error occurred in the WHOIS geolocation database.

Please confirm whether you are a US resident or not by clicking the relevant button below. If you choose the wrong option, being a US resident, you will not be able to open an account with InstaForex anyway.

We are sorry for any inconvenience caused by this message.