empty
21.12.2023 12:42 PM
The inflation report is the cause of all the troubles for the British pound

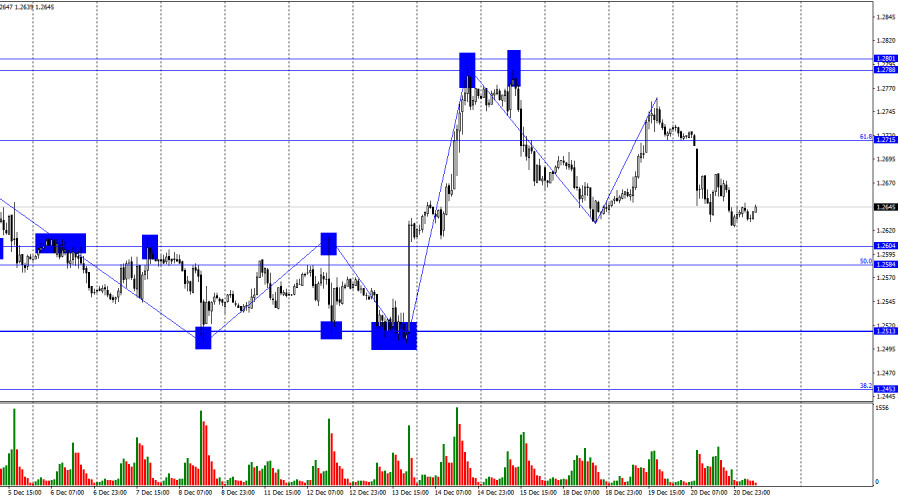
On the hourly chart, the GBP/USD pair reversed in favor of the US dollar on Wednesday, consolidating below the Fibonacci level of 61.8% (1.2715). A new decline towards the support zone of 1.2584–1.2604 began, which the bears have not reached yet. Today, this zone could be tested. A rebound from it would expect a reversal in favor of the euro and a return to the 61.8% level. Firmly establishing below 1.2584–1.2604 increases the probability of continued decline towards the levels of 1.2513 and 1.2453.

This image is no longer relevant

The wave situation is changing in favor of bearish traders. The last upward wave failed to surpass the previous peak (from December 15), thus providing the first sign of a trend change to a "bearish" one. The new downward wave broke the previous low by only a few points. Thus, the prospects for bears remain somewhat unclear, but I still anticipate that this wave is not yet complete, and its target – the zone of 1.2584–1.2604 – will be reached. The new "bearish" trend may take longer than it currently appears.

Yesterday, the inflation report for November in the UK ensured the pound's decline. Despite the skepticism about inflation reduction just a few months ago, Andrew Bailey, who forecasted a return below 5%, turned out to be right. As announced yesterday, the Consumer Price Index has dropped to 3.9%, with December still ahead. Inflation may fall even further before the New Year, much to the delight of the Bank of England.

However, the Bank of England must rejoice in this event in proud solitude. For the pound, news of inflation reduction is negative as it sharply reduces the chances of further tightening the Bank of England's policy. Yesterday, we saw firsthand how traders reacted to the decline in inflation. If today's US GDP report is not weaker than forecasted, bears will have excellent chances to push the zone of 1.2584–1.2604. I believe that in the coming days, a decline in the pair to the level of 1.2513, from which the price bounced three times before, is possible.

This image is no longer relevant

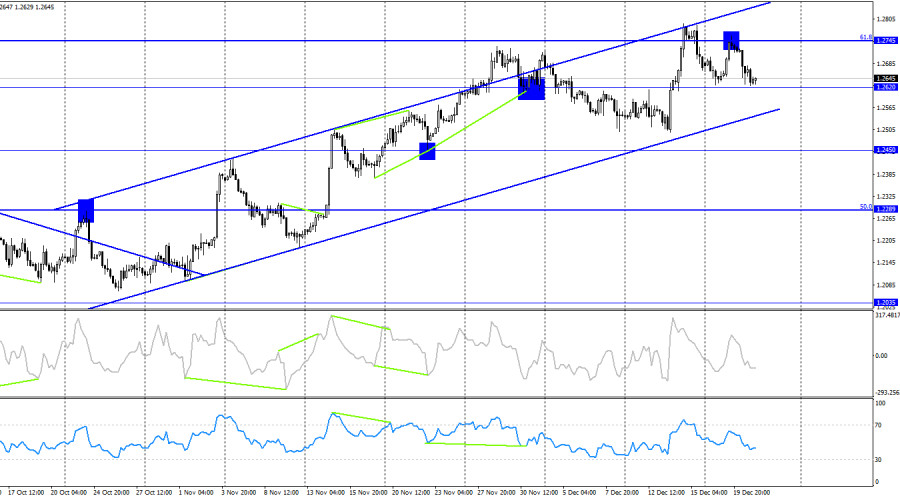
On the 4-hour chart, the pair consolidated below the corrective level of 61.8% (1.2745) and fell to 1.2620. Thus, quotes remain within the ascending trend corridor, and a rebound from its upper line and the level of 1.2745 suggests a decline to the lower line. I expect a significant pound drop only after consolidating below the ascending trend corridor. There are no apparent divergences with any indicator today. A rebound of quotes from the lower line of the ascending corridor will maintain the current "bullish" trend.

Forecast for GBP/USD and trader advice:

Sales of the pound could be opened on a rebound from the zone of 1.2788–1.2801 and on closing below the level of 1.2715. Currently, these deals can be kept open with a target of 1.2604. Today, traders can rely only on the US GDP report, which may support sellers who are simultaneously buyers of the dollar. However, a weaker GDP value than +5.2% will contribute to the pair's return to 1.2715. Purchases will be possible on a rebound from the zone of 1.2584–1.2604 on the hourly chart with a target of 1.2715, but caution is advised when buying the pound.

เลือกช่วงเวลา
5
นาที
15
นาที
30
นาที
1
ชั่วโมง
4
ชั่วโมง
1
วัน
1
สัปดาห์
รับผลกำไรจากการเปลี่ยนแปลงอัตราสกุลเงินดิจิทัลกับ InstaForex.
ดาวน์โหลด MetaTrader 4 และเปิดการซื้อขายครั้งแรกของคุณ.
USD/CAD: การวิเคราะห์และการพยากรณ์ คู่เงิน USD/CAD กำลังแสดงการฟื้นตัวเล็กน้อยจากระดับที่ต่ำกว่า 1.3600 โดยย้อนไปเกือบทั้งหมดของการสูญเสียในวันที่ผ่านมา โดยได้รับการสนับสนุนจากการฟื้นตัวของดอลลาร์สหรัฐ นอกจากนี้ ความกังวลเกี่ยวกับการหยุดชะงักในการจัดหาน้ำมันในตะวันออกกลางกำลังผลักดันราคาน้ำมันดิบให้พุ่งขึ้นอย่างรวดเร็ว ทำให้ราคาของน้ำมันแตะระดับสูงสุดในรอบห้าเดือน เนื่องจากเงินดอลลาร์แคนาดาเป็นสกุลเงินที่เชื่อมโยงกับสินค้าโภคภัณฑ์ ราคาน้ำมันจึงส่งผลต่อค่าของมันเป็นอย่างมาก ประกอบกับความเป็นไปได้ที่ลดลงของการปรับลดอัตราดอกเบี้ยเพิ่มเติมจากธนาคารกลางแคนาดาและความคาดหวังต่อข้อตกลงการค้าระหว่างสหรัฐอเมริกาและแคนาดา ปัจจัยเหล่านี้ช่วยสนับสนุนเงินดอลลาร์แคนาดา โอกาสทางการค้าที่ดีขึ้นและนโยบายการเงินของแคนาดาที่มีเสถียรภาพอาจช่วยให้
  • Grand Choice
    Contest by
    InstaForex
    InstaForex always strives to help you
    fulfill your biggest dreams.
    เข้าร่วมการแข่งขัน


บทความแนะนำ

การคาดการณ์สำหรับ EUR/USD ในวันที่ 13 มิถุนายน 2025

เมื่อวันพฤหัสบดี คู่สกุลเงิน EUR/USD ยังคงเคลื่อนไหวขึ้นและยืนเหนือระดับ 100.0% Fibonacci retracement ที่ 1.1574 อย่างไรก็ตาม ในช่วงกลางคืนเกิดการกลับอย่างรวดเร็วสนับสนุนเงินดอลลาร์สหรัฐ โดยมีการทะลุระดับนี้ลงมา และขณะนี้กำลังลดลงไปสู่ระดับ Fibonacci ที่

Samir Klishi 11:52 2025-06-13 UTC+2

การคาดการณ์สำหรับ GBP/USD ในวันที่ 13 มิถุนายน 2025

ในกราฟรายชั่วโมง คู่ GBP/USD ในวันพฤหัสบดีปรับตัวขึ้นจากระดับ 1.3520 พุ่งขึ้นไปยังโซนแนวต้านที่ 1.3611–1.3620 กระดอนจากสองครั้งก่อนที่จะลดลงสู่ระดับฟีโบนักชี retracement ที่ 127.2% ที่ 1.3527 การดีดกลับจากระดับนี้อีกครั้งจะสนับสนุนค่าเงินปอนด์และบ่งบอกถึงการเติบโตเพิ่มเติมไปยังระดับ 1.3611–1.3620

Samir Klishi 11:49 2025-06-13 UTC+2

EUR/USD. วันที่ 12 มิถุนายน: การถอยหลังของดอลลาร์​

สวัสดีครับ/ค่ะ เทรดเดอร์ทุกท่าน! เมื่อวันพุธที่ผ่านมา คู่เงิน EUR/USD ยังคงเคลื่อนไหวขึ้นต่อเนื่องหลังจากดีดตัวจากโซนสนับสนุนที่ 1.1374–1.1380 โดยสามารถปิดแนวเหนือระดับ Fibonacci retracement ที่ 76.4% ที่ 1.1454 ได้สำเร็จ

Samir Klishi 10:15 2025-06-12 UTC+2

GBP/USD. 12 มิถุนายน. ประชาธิปไตยยักษ์ใหญ่ของสหราชอาณาจักรคลอดภัย

สวัสดีครับผู้ค้าทุกท่าน! จากแผนภูมิทุกชั่วโมงในวันพุธ, คู่ GBP/USD ได้เปลี่ยนสภาพง่ายๆ ให้โดยการขยายด้านที่ดีของบาทสหภาพประชาชาติและรวมกันที่ระดับการถอยหลังของฟิโบนัชชี 161.8% ที่ 1.3520. สิ่งนี้เปิดทางให้เกิดการเติบโตเพิ่มเติมสู่โซนการต้านทานที่ 1.3611–1.3620. การสะท้อนกลับไปในโซนนี้จะทำให้เกิดประโยชน์ให้กับดอลลาร์สหรัฐฯและนำไปสู่การถดถอยลงอย่างเล็กน้อยสู่ 1.3520. การรวมกันที่อยู่เหนือโซน 1.3611–1.3620

Samir Klishi 10:15 2025-06-12 UTC+2

การวิเคราะห์ทางเทคนิคของการเคลื่อนไหวของราคาน้ำมันดิบรายวัน วันพฤหัสบดีที่ 12 มิถุนายน 2025

หากเรามองที่กราฟรายวันของเครื่องประเมินค่าสินค้า Crude Oil จะเห็นได้ว่ามีสภาวะ Divergence ระหว่างการเคลื่อนไหวของราคา #CL กับตัวบ่งชี้ Stochastic Oscillator ซึ่งบ่งชี้ว่ามีความเป็นไปได้ที่ #CL จะเผชิญกับการปรับฐานลงในอีกไม่กี่วันข้างหน้า แต่ตราบที่การปรับฐานไม่ทะลุและปิดต่ำกว่าระดับ 59.86

Arief Makmur 08:10 2025-06-12 UTC+2

การวิเคราะห์ทางเทคนิคของการเคลื่อนไหวของราคาภายในวันของดัชนี Nasdaq 100, วันพฤหัสบดีที่ 12 มิถุนายน 2025

บนกราฟ 4 ชั่วโมงของดัชนี Nasdaq 100 มีการเบี่ยงเบนระหว่างการเคลื่อนไหวของราคากับตัวบ่งชี้ Stochastic Oscillator อย่างชัดเจน โดยเฉพาะอย่างยิ่งเมื่อนำมารวมกับการยืนยันการเคลื่อนไหวของราคา #NDX ที่กำลังเคลื่อนที่ต่ำกว่า EMA (21) ซึ่งเพิ่มความเป็นไปได้อย่างมากที่ดัชนีอาจอ่อนลงในอนาคตอันใกล้ถึงระดับ

Arief Makmur 08:10 2025-06-12 UTC+2

สัญญาณการซื้อขายสำหรับ EUR/USD สำหรับวันที่ 12-19 มิถุนายน 2025: ขายต่ำกว่า 1.1500 (21 SMA - 8/8 Murray)

กราฟรายวันแสดงให้เห็นว่า EUR/USD มีการซื้อขายภายในช่องทางขาขึ้นตั้งแต่เดือนกุมภาพันธ์ และมีแนวโน้มที่จะเพิ่มขึ้นต่อเนื่องเพื่อไปถึงระดับสูงสุดในเดือนเมษายนที่ประมาณ 1.1571 ทั้งยังอาจจะสูงถึงระดับ 8/8 Murray ที่ 1.1714 อีกด้วย ดังนั้น การเข้าซื้อคู่เงิน EUR/USD ขณะที่ราคายังคงปรับตัวเหนือค่าเฉลี่ยเคลื่อนที่

Dimitrios Zappas 05:33 2025-06-12 UTC+2

สัญญาณการเทรดสำหรับทองคำ (XAU/USD) ระหว่างวันที่ 12-19 มิถุนายน 2025: ขายเมื่อราคาต่ำกว่า $3,386 (21 SMA - 7/8 Murray)

แนวโน้มของ XAU/USD ยังคงเป็นขาขึ้นตราบใดที่ราคาคงที่เหนือ 3,331 ดังนั้น จึงควรซื้อทองคำตราบใดที่ราคาคงที่เหนือ 3,359 ซึ่งเป็นตำแหน่งของระดับ 7/8 ของ Murray ความผันผวนของทองคำจะยังคงมีต่อไปในไม่กี่วันข้างหน้า โดยเราคาดว่าราคาจะเคลื่อนไหวระหว่าง 3,386

Dimitrios Zappas 05:32 2025-06-12 UTC+2

การพยากรณ์ EUR/USD สำหรับวันที่ 12 มิถุนายน 2025

ข้อมูลเงินเฟ้อของสหรัฐที่เปิดเผยในวันพุธทำให้ตลาดเกิดความเคลื่อนไหว: ดัชนีดอลลาร์ลดลง 0.47%, น้ำมัน WTI พุ่งขึ้น 5.54%, ราคาทองคำเพิ่มขึ้น 1.27%, และอัตราผลตอบแทนพันธบัตรรัฐบาลสหรัฐอายุ 5 ปีลดลงจาก 4.08% เป็น 4.01%

Laurie Bailey 04:40 2025-06-12 UTC+2

การคาดการณ์ GBP/USD สำหรับวันที่ 12 มิถุนายน 2025

เมื่อวันพุธที่ผ่านมา เงินปอนด์อังกฤษสามารถหลีกเลี่ยงการลงต่ำกว่าระดับแนวรับทางเทคนิคได้อย่างสำเร็จ โดยได้กลับทิศทางขึ้นจากระดับดังกล่าว ราคาฟื้นตัวจากเส้นดัชนี MACD ในกราฟรายวัน ขณะเดียวกัน ตัวบ่งชี้ Marlin ก็ปรับทิศทางขึ้นจากขอบเขตล่างของช่องขาขึ้นของมัน ราคากำลังเคลื่อนไหวไปยังเป้าหมายแรกที่ 1.3635 และเมื่อลงไปถึงต่ำกว่าจุดนี้ จะเคลื่อนไปยังเส้นด้านในของช่องราคาใกล้ 1.3714

Laurie Bailey 04:40 2025-06-12 UTC+2
หากไม่สะดวกคุยในตอนนี้
ระบุคำถามไว้ได้ใน แชท.
Widget callback
 

Dear visitor,

Your IP address shows that you are currently located in the USA. If you are a resident of the United States, you are prohibited from using the services of InstaFintech Group including online trading, online transfers, deposit/withdrawal of funds, etc.

If you think you are seeing this message by mistake and your location is not the US, kindly proceed to the website. Otherwise, you must leave the website in order to comply with government restrictions.

Why does your IP address show your location as the USA?

  • - you are using a VPN provided by a hosting company based in the United States;
  • - your IP does not have proper WHOIS records;
  • - an error occurred in the WHOIS geolocation database.

Please confirm whether you are a US resident or not by clicking the relevant button below. If you choose the wrong option, being a US resident, you will not be able to open an account with InstaForex anyway.

We are sorry for any inconvenience caused by this message.