signal strength 1 of 5
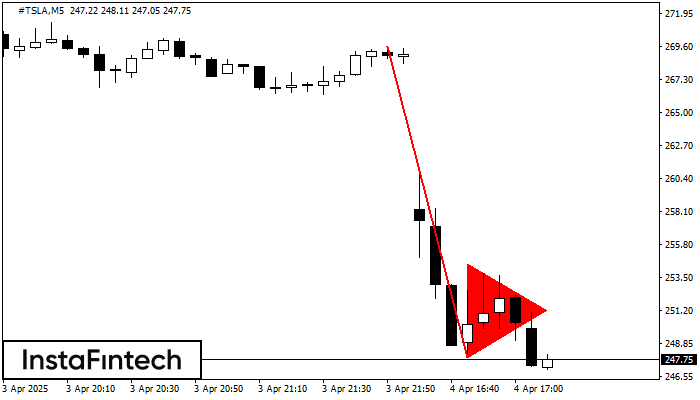
The Bearish pennant pattern has formed on the #TSLA M5 chart. It signals potential continuation of the existing trend. Specifications: the pattern’s bottom has the coordinate of 247.91; the projection of the flagpole height is equal to 2171 pips. In case the price breaks out the pattern’s bottom of 247.91, the downtrend is expected to continue for further level 247.76.
The M5 and M15 time frames may have more false entry points.
- All
- Double Top
- Flag
- Head and Shoulders
- Pennant
- Rectangle
- Triangle
- Triple top
- All
- #AAPL
- #AMZN
- #Bitcoin
- #EBAY
- #FB
- #GOOG
- #INTC
- #KO
- #MA
- #MCD
- #MSFT
- #NTDOY
- #PEP
- #TSLA
- #TWTR
- AUDCAD
- AUDCHF
- AUDJPY
- AUDUSD
- EURCAD
- EURCHF
- EURGBP
- EURJPY
- EURNZD
- EURRUB
- EURUSD
- GBPAUD
- GBPCHF
- GBPJPY
- GBPUSD
- GOLD
- NZDCAD
- NZDCHF
- NZDJPY
- NZDUSD
- SILVER
- USDCAD
- USDCHF
- USDJPY
- USDRUB
- All
- M5
- M15
- M30
- H1
- D1
- All
- Buy
- Sale
- All
- 1
- 2
- 3
- 4
- 5
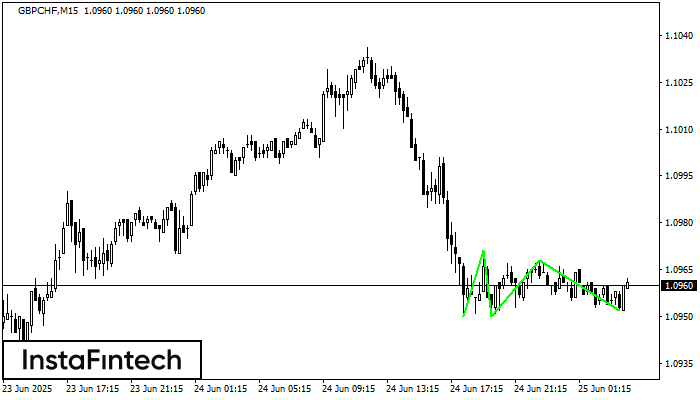
The Triple Bottom pattern has formed on the chart of GBPCHF M15. Features of the pattern: The lower line of the pattern has coordinates 1.0971 with the upper limit 1.0971/1.0968
The M5 and M15 time frames may have more false entry points.
Открыть график инструмента в новом окне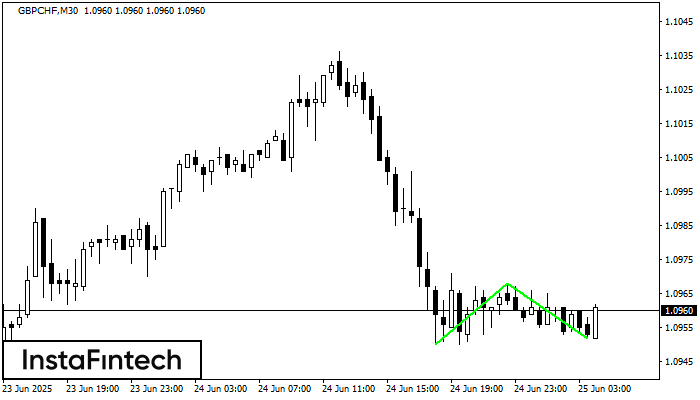
The Double Bottom pattern has been formed on GBPCHF M30. This formation signals a reversal of the trend from downwards to upwards. The signal is that a buy trade should
Открыть график инструмента в новом окне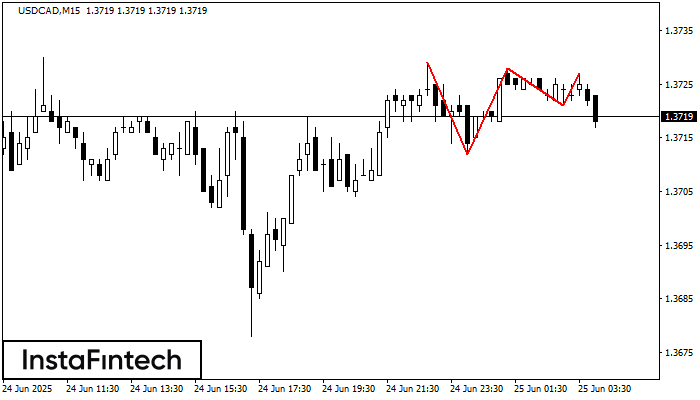
The Triple Top pattern has formed on the chart of the USDCAD M15. Features of the pattern: borders have an ascending angle; the lower line of the pattern
The M5 and M15 time frames may have more false entry points.
Открыть график инструмента в новом окне