


signal strength 1 of 5
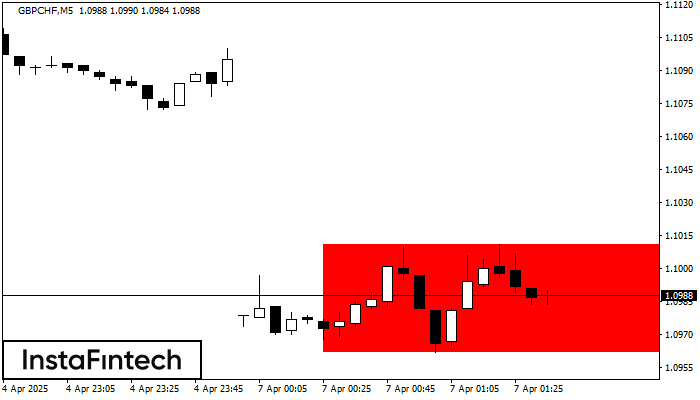
According to the chart of M5, GBPCHF formed the Bearish Rectangle. The pattern indicates a trend continuation. The upper border is 1.1011, the lower border is 1.0962. The signal means that a short position should be opened after fixing a price below the lower border 1.0962 of the Bearish Rectangle.
The M5 and M15 time frames may have more false entry points.
ดูเพิ่มเติม
- All
- Double Top
- Flag
- Head and Shoulders
- Pennant
- Rectangle
- Triangle
- Triple top
- All
- #AAPL
- #AMZN
- #Bitcoin
- #EBAY
- #FB
- #GOOG
- #INTC
- #KO
- #MA
- #MCD
- #MSFT
- #NTDOY
- #PEP
- #TSLA
- #TWTR
- AUDCAD
- AUDCHF
- AUDJPY
- AUDUSD
- EURCAD
- EURCHF
- EURGBP
- EURJPY
- EURNZD
- EURRUB
- EURUSD
- GBPAUD
- GBPCHF
- GBPJPY
- GBPUSD
- GOLD
- NZDCAD
- NZDCHF
- NZDJPY
- NZDUSD
- SILVER
- USDCAD
- USDCHF
- USDJPY
- USDRUB
- All
- M5
- M15
- M30
- H1
- D1
- All
- Buy
- Sale
- All
- 1
- 2
- 3
- 4
- 5
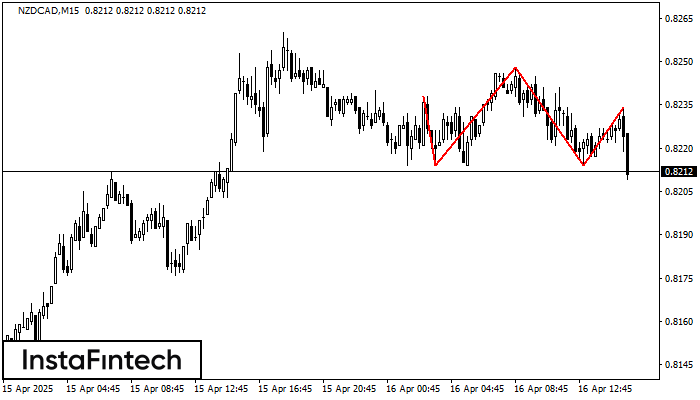
The NZDCAD M15 formed the Head and Shoulders pattern with the following features: The Head’s top is at 0.8248, the Neckline and the upward angle are at 0.8214/0.8214. The formation
The M5 and M15 time frames may have more false entry points.
Open chart in a new window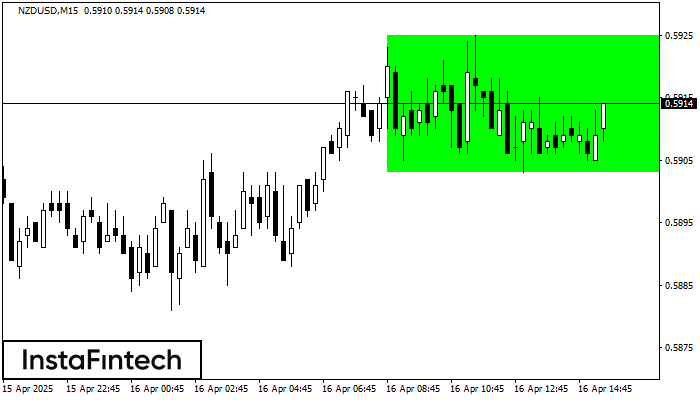
According to the chart of M15, NZDUSD formed the Bullish Rectangle which is a pattern of a trend continuation. The pattern is contained within the following borders: the lower border
The M5 and M15 time frames may have more false entry points.
Open chart in a new window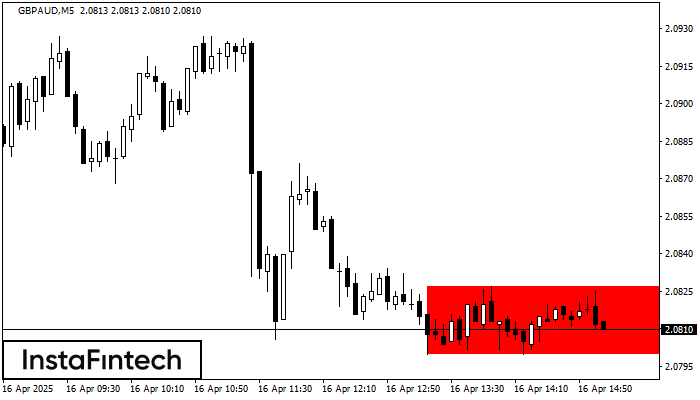
According to the chart of M5, GBPAUD formed the Bearish Rectangle. This type of a pattern indicates a trend continuation. It consists of two levels: resistance 2.0827 - 0.0000
The M5 and M15 time frames may have more false entry points.
Open chart in a new window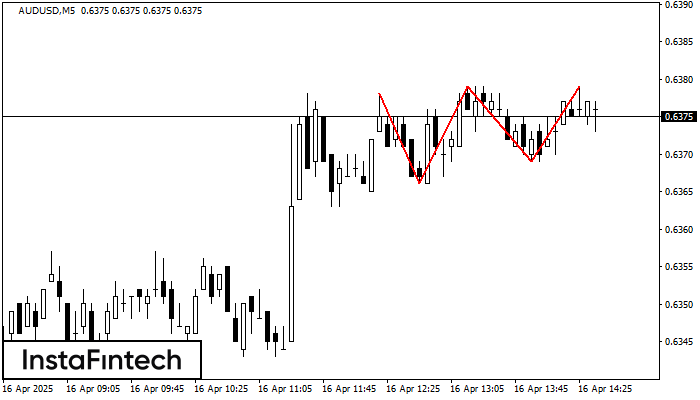
On the chart of the AUDUSD M5 trading instrument, the Triple Top pattern that signals a trend change has formed. It is possible that after formation of the third peak
The M5 and M15 time frames may have more false entry points.
Open chart in a new window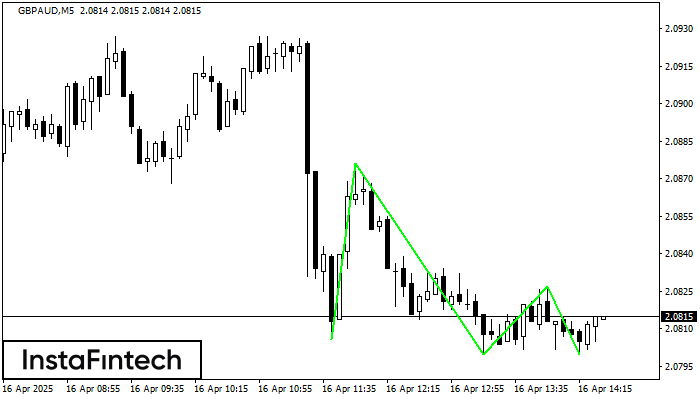
The Triple Bottom pattern has formed on the chart of the GBPAUD M5 trading instrument. The pattern signals a change in the trend from downwards to upwards in the case
The M5 and M15 time frames may have more false entry points.
Open chart in a new window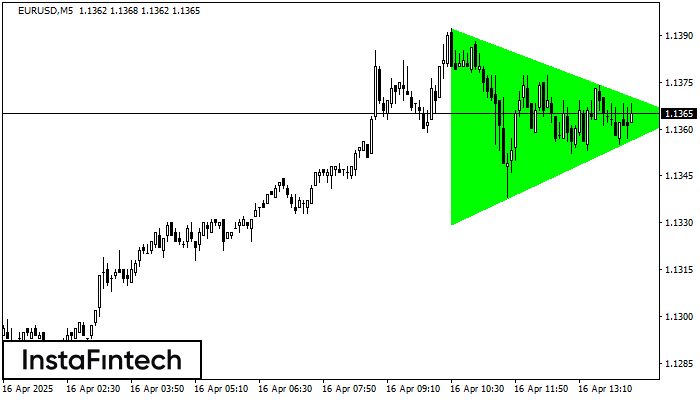
According to the chart of M5, EURUSD formed the Bullish Symmetrical Triangle pattern, which signals the trend will continue. Description. The upper border of the pattern touches the coordinates 1.1392/1.1364
The M5 and M15 time frames may have more false entry points.
Open chart in a new window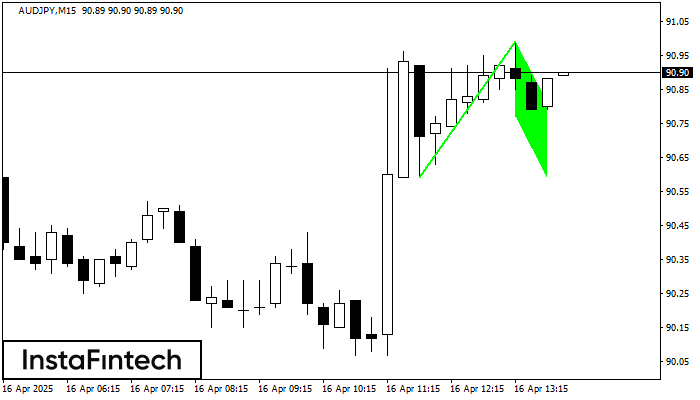
The Bullish Flag pattern has been formed on AUDJPY at M15. The lower boundary of the pattern is located at 90.77/90.59, while the higher boundary lies at 90.99/90.81. The projection
The M5 and M15 time frames may have more false entry points.
Open chart in a new window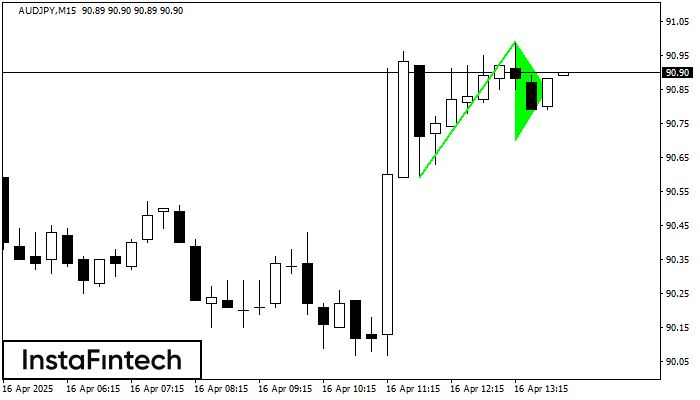
The Bullish pennant graphic pattern has formed on the AUDJPY M15 instrument. This pattern type falls under the category of continuation patterns. In this case, if the quote can breaks
The M5 and M15 time frames may have more false entry points.
Open chart in a new window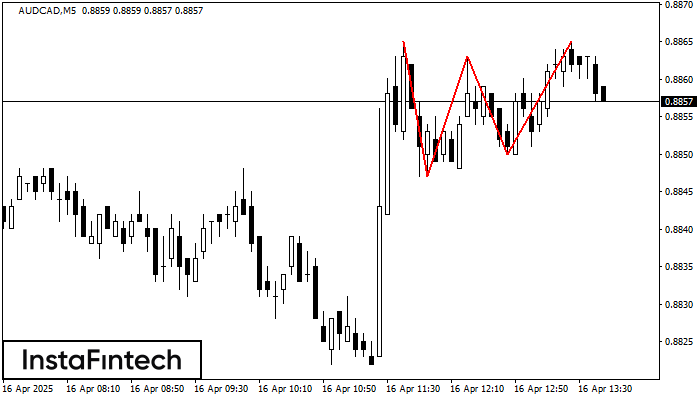
On the chart of the AUDCAD M5 trading instrument, the Triple Top pattern that signals a trend change has formed. It is possible that after formation of the third peak
The M5 and M15 time frames may have more false entry points.
Open chart in a new window


