signal strength 1 of 5

According to the chart of M5, GBPAUD formed the Bullish Symmetrical Triangle pattern. The lower border of the pattern touches the coordinates 2.0704/2.0775 whereas the upper border goes across 2.0831/2.0775. If the Bullish Symmetrical Triangle pattern is in progress, this evidently signals a further upward trend. In other words, in case the scenario comes true, the price of GBPAUD will breach the upper border to head for 2.0790.
The M5 and M15 time frames may have more false entry points.
Xem thêm
- All
- Double Top
- Flag
- Head and Shoulders
- Pennant
- Rectangle
- Triangle
- Triple top
- All
- #AAPL
- #AMZN
- #Bitcoin
- #EBAY
- #FB
- #GOOG
- #INTC
- #KO
- #MA
- #MCD
- #MSFT
- #NTDOY
- #PEP
- #TSLA
- #TWTR
- AUDCAD
- AUDCHF
- AUDJPY
- AUDUSD
- EURCAD
- EURCHF
- EURGBP
- EURJPY
- EURNZD
- EURRUB
- EURUSD
- GBPAUD
- GBPCHF
- GBPJPY
- GBPUSD
- GOLD
- NZDCAD
- NZDCHF
- NZDJPY
- NZDUSD
- SILVER
- USDCAD
- USDCHF
- USDJPY
- USDRUB
- All
- M5
- M15
- M30
- H1
- D1
- All
- Buy
- Sale
- All
- 1
- 2
- 3
- 4
- 5
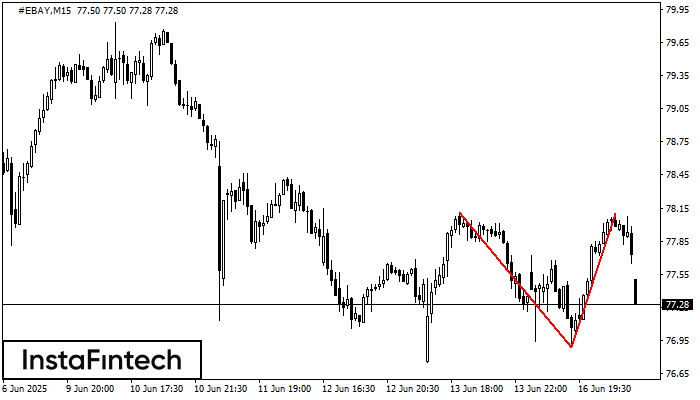
Mô hình đảo chiều Đỉnh đôi đã được hình thành trên #EBAY M15. Đặc điểm: ranh giới trên 78.11; ranh giới dưới 76.89; chiều rộng của mô hình
Khung thời gian M5 và M15 có thể có nhiều điểm vào lệnh sai hơn.
Open chart in a new window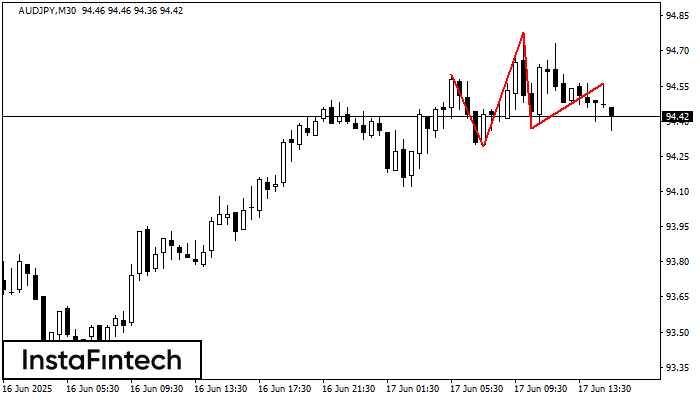
AUDJPY M30 đã hình thành mô hình Đầu và vai với các tính năng sau: Đỉnh của Đầu là 94.78, Đường viền cổ và góc hướng lên là 94.29/94.37
Open chart in a new window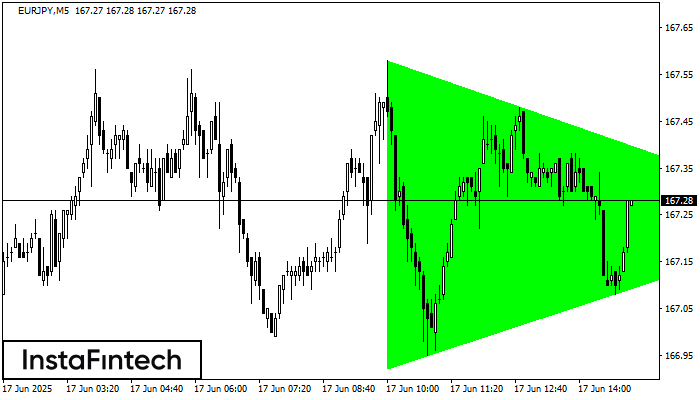
Theo biểu đồ của M5, EURJPY đã hình thành mô hình Tam giác Cân Tăng. Đường biên giới thấp hơn của mô hình chạm tọa độ 166.92/167.24 trong khi đường
Khung thời gian M5 và M15 có thể có nhiều điểm vào lệnh sai hơn.
Open chart in a new window